

Hi Dude ✌️
Welcome to this free Analysis 1.0!!! 🆓
In case you missed it:
If you haven’t yet, subscribe to get access to these posts, and also:
📅 Daily Updates: My take on daily macro events and earnings reports.
🗓️ Weekly Recaps: A summary of the week’s most important financial events.
📊 Stock Analyses: Access to a comprehensive library of all previously analyzed stocks and exclusive, detailed, and data-driven analysis of new stocks.
✅ Monthly Best Buys: A monthly list of the top-5 stocks for that month.
📈 Watchlist & Portfolio: Exclusive access to my current watchlist and portfolio.
⏰ Live Tracking: Receive alerts when I buy or sell a stock.
🧮 Interactive Tools: Downloadable Excel files where you can play and make your own assumptions for the valuation of the stocks I analyze.
🎓 Learn: Weekly posts explaining key financial concepts.
Apple Analysis 1.0
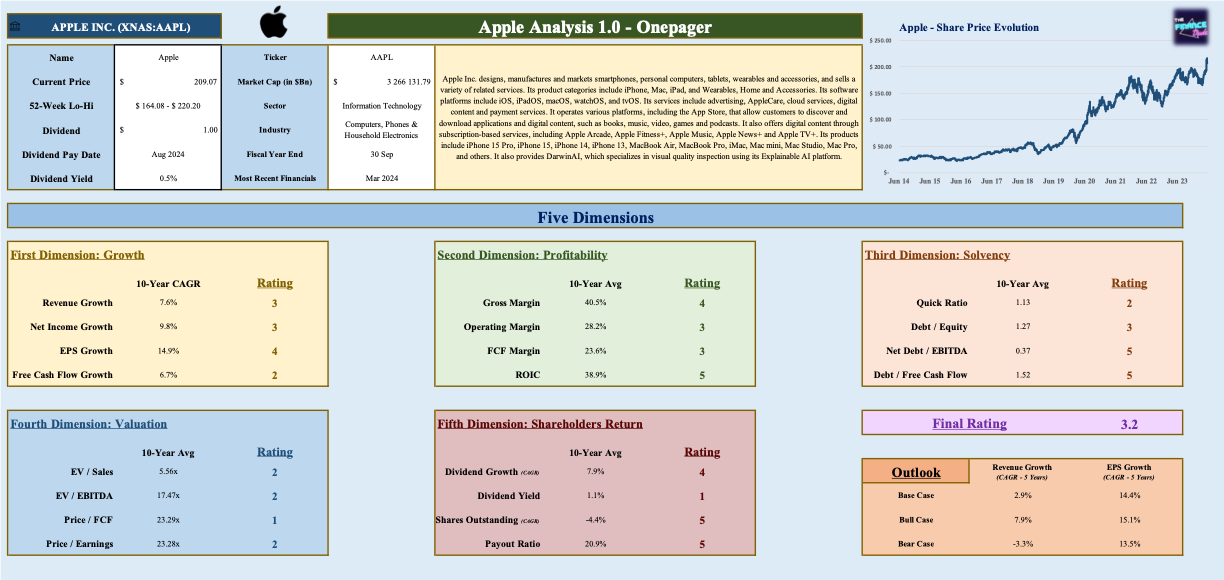
🏢 Company name: Apple Inc.
🔎 Ticker: AAPL
📈 Current Stock Price: $209.07
⚖️ 52-Week Lo-Hi: $164.08 - $220.20
🗄️ Sector: Information Technology
🗂️ Industry: Computers, Phones & Household Electronics
💰 Market cap: $3,266.13 Billion
💵 Dividend Yield: 0.5%
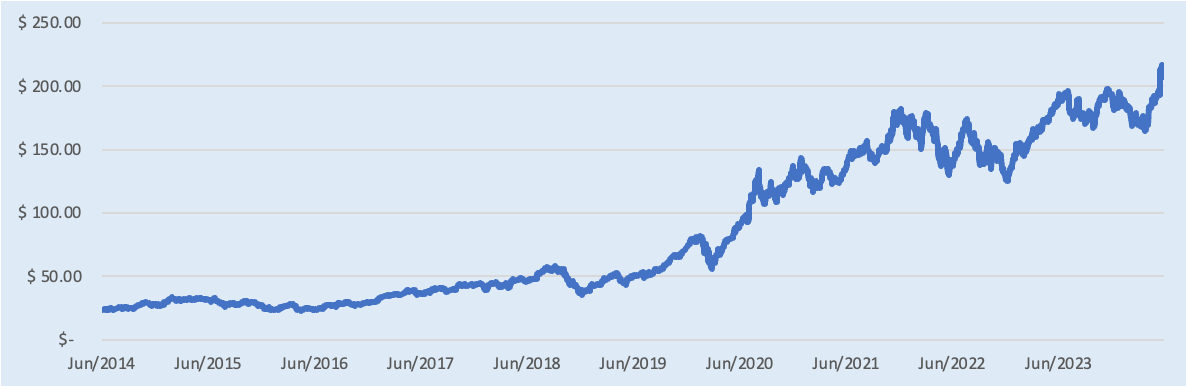
Apple Share Price Evolution
Apple Inc. designs, manufactures, and markets smartphones, personal computers, tablets, wearables, and accessories, and sells a variety of related services. Its product categories include iPhone, Mac, iPad, and Wearables, Home and Accessories. Its software platforms include iOS, iPadOS, macOS, watchOS, and tvOS. Its services include advertising, AppleCare, cloud services, digital content, and payment services. It operates various platforms, including the App Store, that allow customers to discover and download applications and digital content, such as books, music, video, games, and podcasts. It also offers digital content through subscription-based services, including Apple Arcade, Apple Fitness+, Apple Music, Apple News+, and Apple TV+.
Apple Onepager
I. Five Dimensions
First Dimension: Growth 📈
Revenue Growth
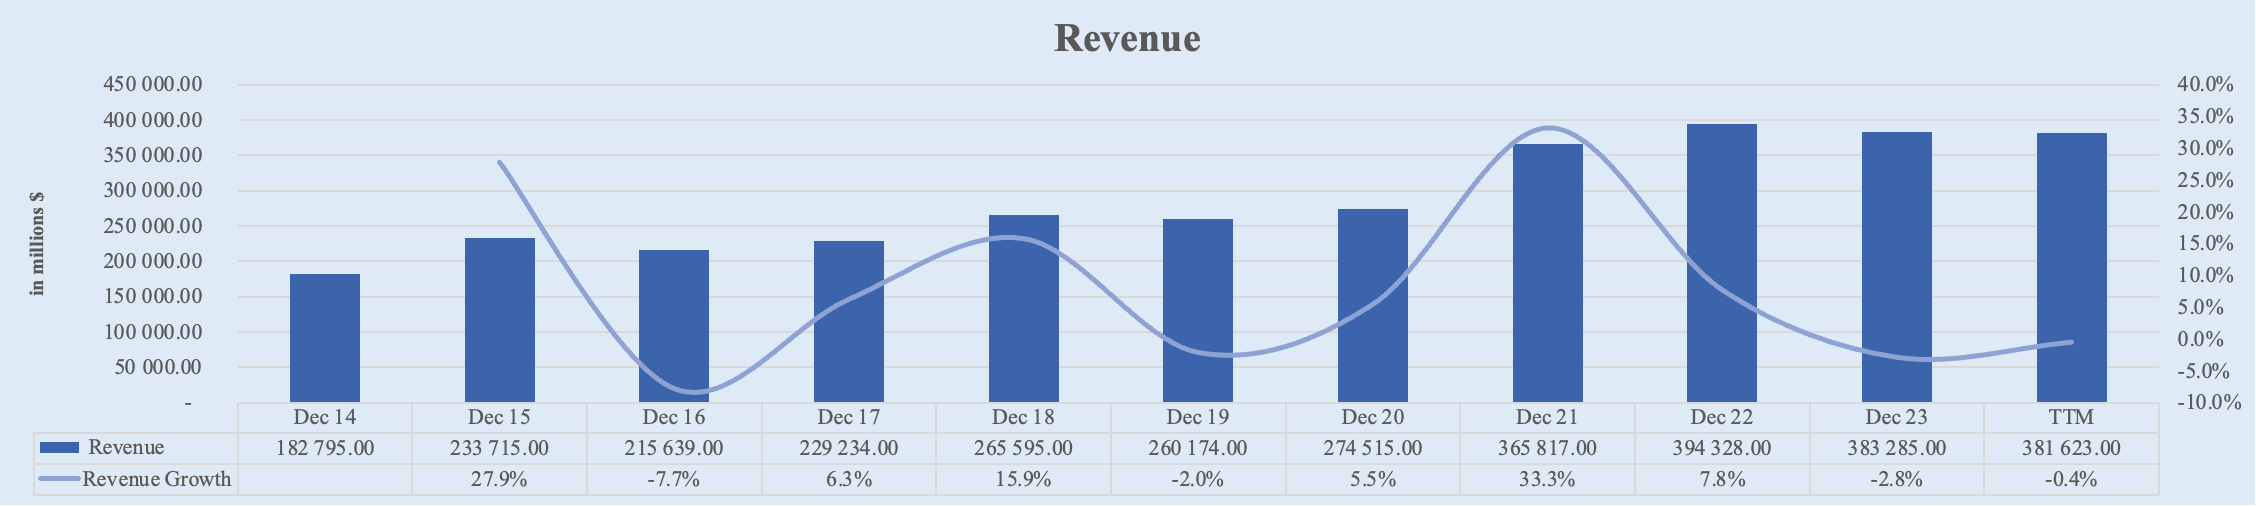
Apple's revenue has shown moderate growth over the past decade. Starting from $182.8 billion in FY 2014, it increased to $383.3 billion in FY 2023. Over the TTM, Apple’s revenue slightly decreased to $381.6 billion. This represents a 5-year CAGR of 7.5% and a 10-year CAGR of 7.6%.
FY 2014: $182,795M
FY 2023: $383,285M
TTM: $381,623M
5-Year CAGR: 7.5%
10-Year CAGR: 7.6%
Rating: 3
Net Income Growth
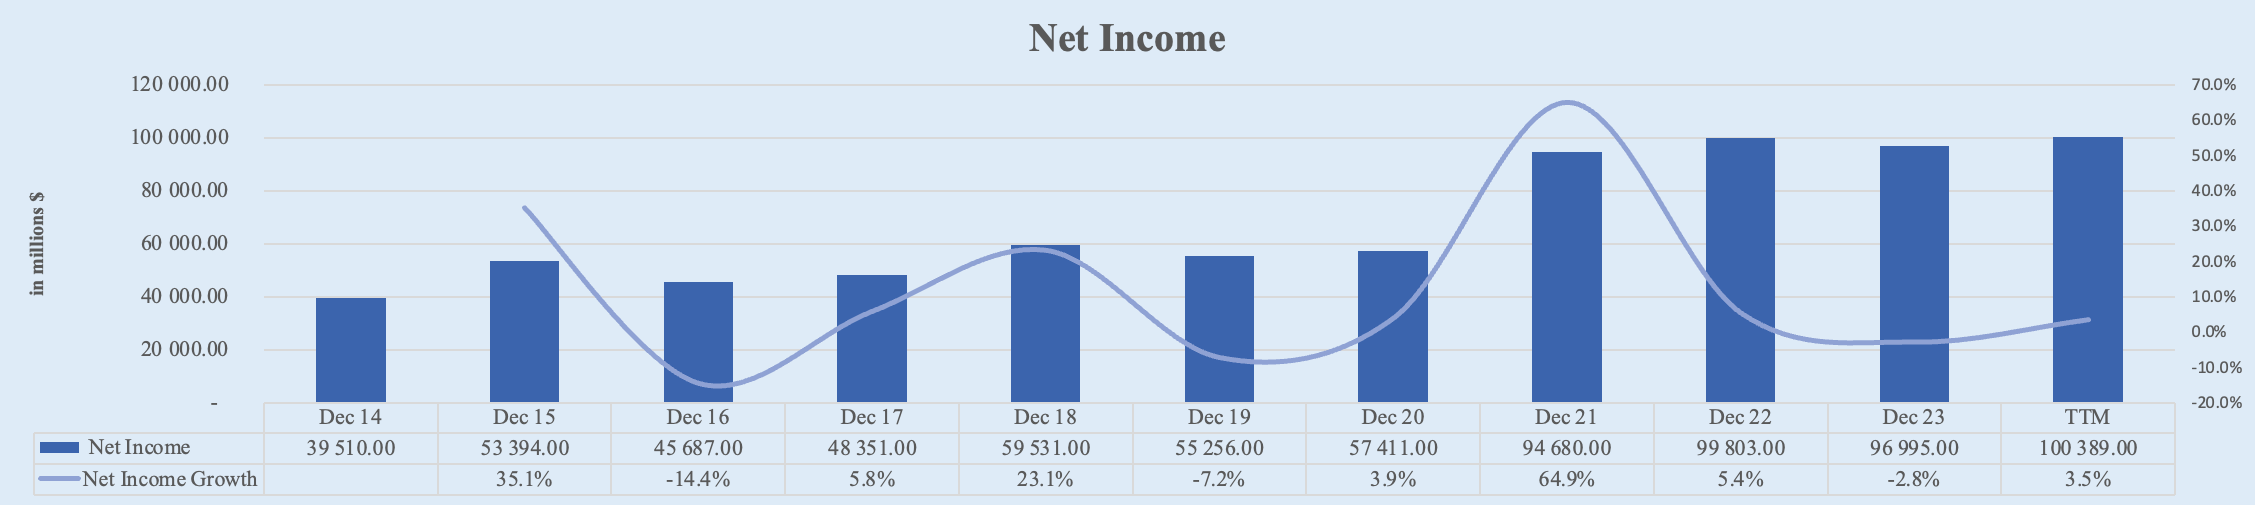
Apple's net income has shown strong growth over the past decade. Starting from $39.5 billion in FY 2014, it increased to $97.0 billion in FY 2023. Over the TTM, Apple’s net income increased to $100.4 billion. This represents a 5-year CAGR of 11.0% and a 10-year CAGR of 9.8%.
FY 2014: $39,510M
FY 2023: $96,995M
TTM: $100,389M
5-Year CAGR: 11.0%
10-Year CAGR: 9.8%
Rating: 4
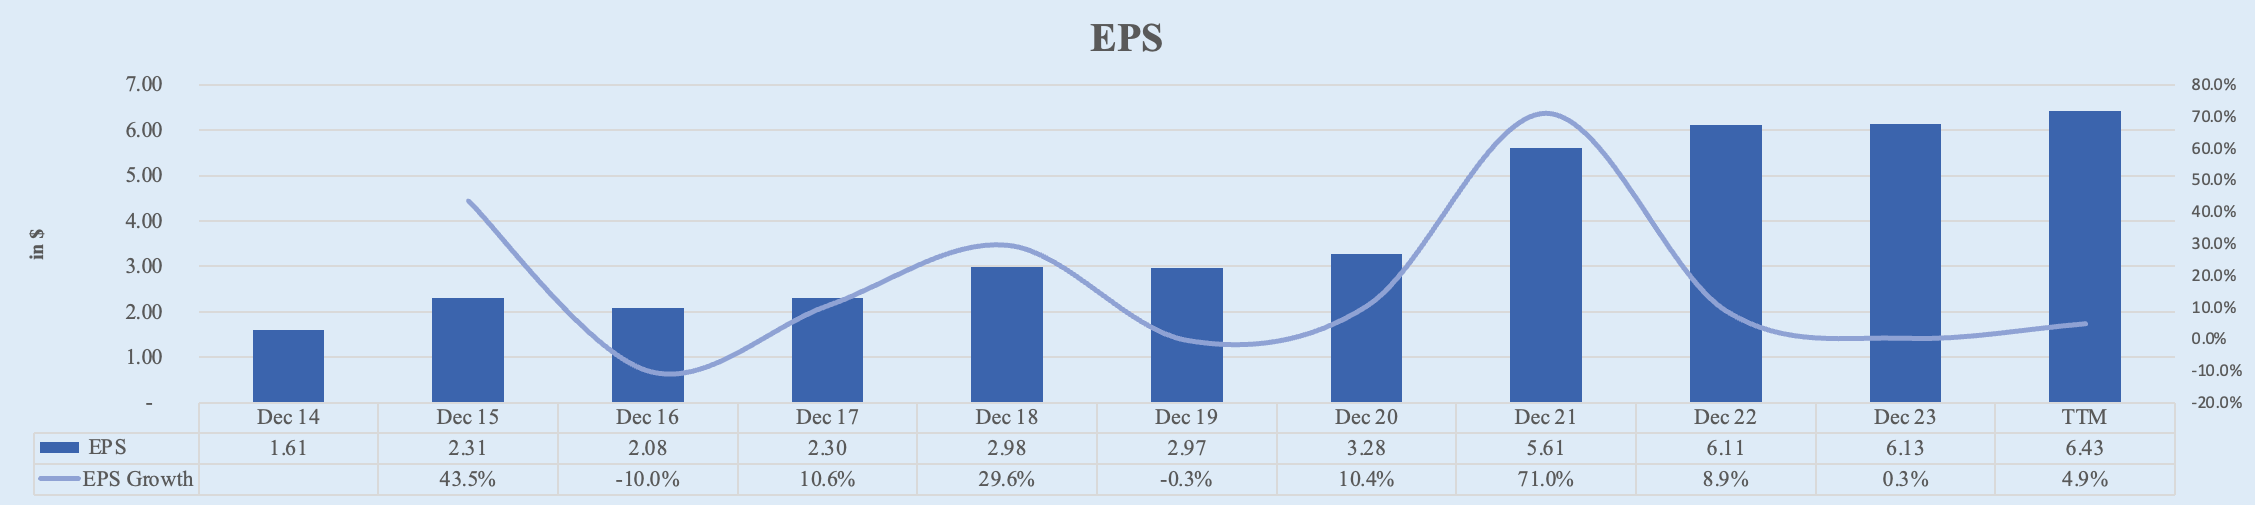
EPS Growth
Apple's EPS has shown significant growth over the past decade. Starting from $1.61 in FY 2014, it increased to $6.13 in FY 2023. Over the TTM, Apple’s EPS further increased to $6.43. This represents a 5-year CAGR of 16.6% and a 10-year CAGR of 14.9%.
While net income has grown at a robust rate (10-Year CAGR: 9.8%), the EPS growth rate (10-Year CAGR: 14.9%) is even higher, indicating an additional factor at play. This discrepancy can primarily be attributed to Apple's aggressive share repurchase (buyback) program.
Understanding EPS:
EPS is calculated as:
EPS = Net Income / Shares Outstanding
EPS growth can be driven by two main factors:
1. Increase in Net Income: Higher profits generated by the company.
2. Reduction in Shares Outstanding: Fewer shares among which the net income is distributed, resulting in a higher EPS.
Impact on EPS: With fewer shares outstanding, the same amount of net income is spread over a smaller number of shares, resulting in a higher EPS. This mechanism is a major reason why EPS growth can outpace net income growth.
FY 2014: $1.61
FY 2023: $6.13
TTM: $6.43
5-Year CAGR: 16.6%
10-Year CAGR: 14.9%
Rating: 4
Free Cash Flow Growth
Apple's free cash flow has shown moderate growth over the past decade. Starting from $47.3 billion in FY 2014, it increased to $88.8 billion in FY 2023. Over the TTM, Apple’s free cash flow slightly increased to $90.7 billion. This represents a 5-year CAGR of 9.1% and a 10-year CAGR of 6.7%.
FY 2014: $47,279M
FY 2023: $88,751M
TTM: $90,716M
5-Year CAGR: 9.1%
10-Year CAGR: 6.7%
Rating: 2

Main Growth Drivers:
1. Innovation in Products and Services
Apple's consistent innovation in its product line has been a significant driver of its growth. The launch of the iPhone revolutionized the smartphone industry and has remained the cornerstone of Apple's product portfolio, accounting for a substantial portion of its revenue. The introduction of other successful products like the iPad, Apple Watch, and AirPods further diversified its revenue streams and solidified its market position.
2. Expansion of the Services Segment
Apple has successfully expanded its services segment, which includes Apple Music, Apple TV+, Apple Pay, and the App Store. This segment has grown rapidly and contributed significantly to Apple's revenue, providing a steady stream of recurring income and reducing reliance on hardware sales alone. The services segment's high margins have also enhanced overall profitability.
3. Transition to In-House Silicon
The transition from Intel processors to Apple's own M1, M2, and M3 chips has been a game-changer. This shift has allowed Apple to better control the performance, efficiency, and integration of its hardware and software, leading to superior product performance and customer satisfaction. The M1 chip, in particular, has set new standards for performance per watt in the industry.
4. Robust Marketing and Brand Loyalty
Apple's marketing strategies and strong brand loyalty have been pivotal in maintaining its competitive edge. The company has consistently emphasized design, user experience, and premium quality, which has fostered a loyal customer base willing to pay a premium for Apple products. This brand loyalty has translated into strong sales and market dominance.
5. Global Expansion and Market Penetration
Apple has significantly expanded its global footprint, particularly in emerging markets. The company's efforts to tailor products and services to local markets have helped it capture new customer segments and drive growth in regions like China and India.
6. Focus on Ecosystem Integration
Apple's focus on creating a seamless and integrated ecosystem of devices and services has enhanced customer retention and cross-selling opportunities. The interconnectedness of Apple's products and services encourages customers to stay within the Apple ecosystem, driving repeat purchases and increased spending per customer.
Second Dimension: Profitability 💰
Gross Margin
Apple's gross margin has shown slight improvement over the past decade. Starting from 38.6% in FY 2014, it increased to 45.6% over LTM. This represents a 5-year average of 41.8% and a 10-year average of 40.5%.
FY 2014: 38.6%
FY 2023: 44.1%
TTM: 45.6%
5-Year Average: 41.8%
10-Year Average: 40.5%
Rating: 4

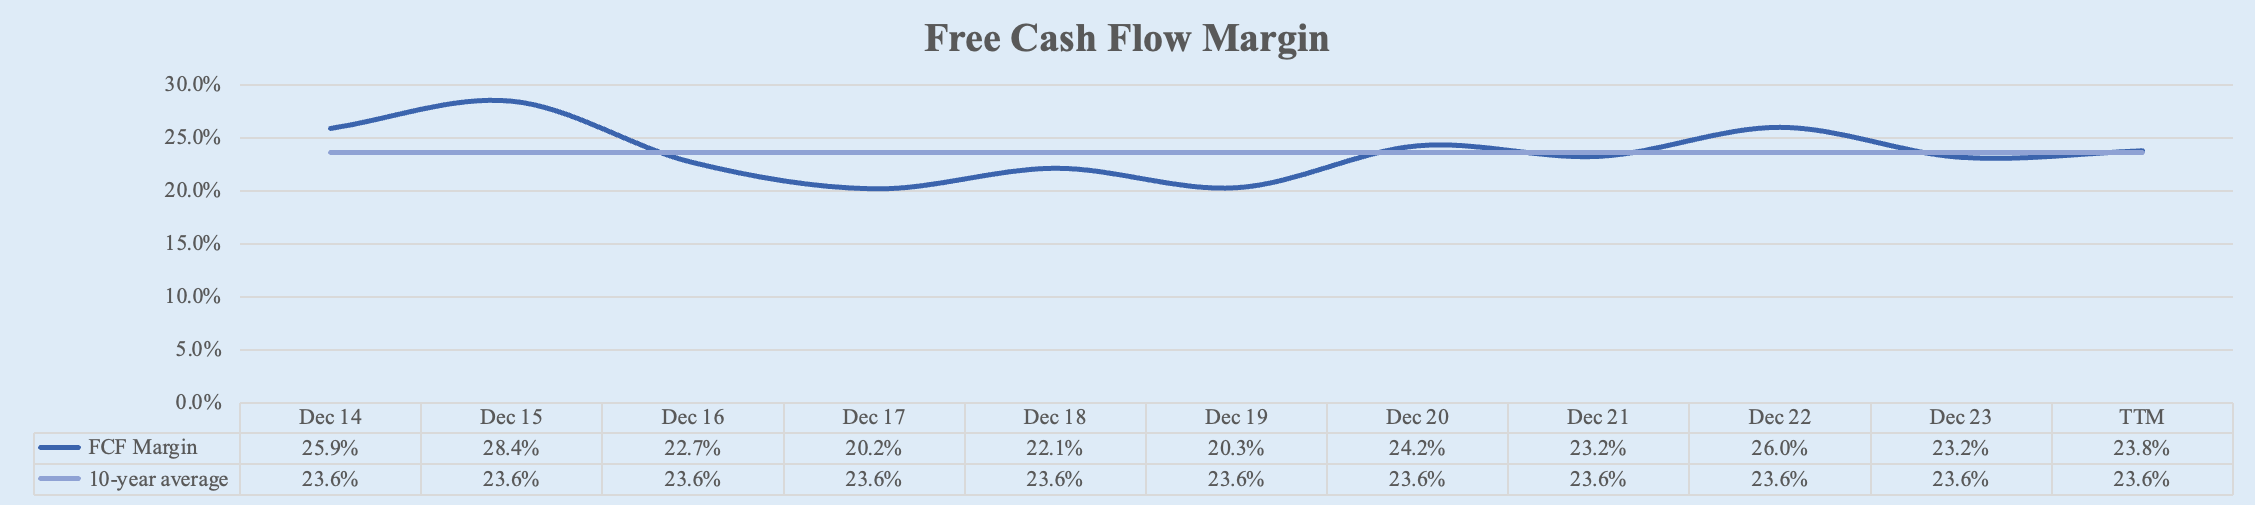
FCF Margin
Apple's free cash flow margin has remained relatively stable within the 20%-25% range over the past decade. Starting at 25.9% in FY 2014, it saw a slight decline to 23.2% by FY 2023. Recently, over the trailing twelve months (TTM), Apple’s FCF margin has increased slightly to 23.8%. This trend reflects a 5-year average of 23.4% and a 10-year average of 23.6%.
FY 2014: 25.9%
FY 2023: 23.2%
TTM: 23.8%
5-Year Average: 23.4%
10-Year Average: 23.6%
Rating: 3
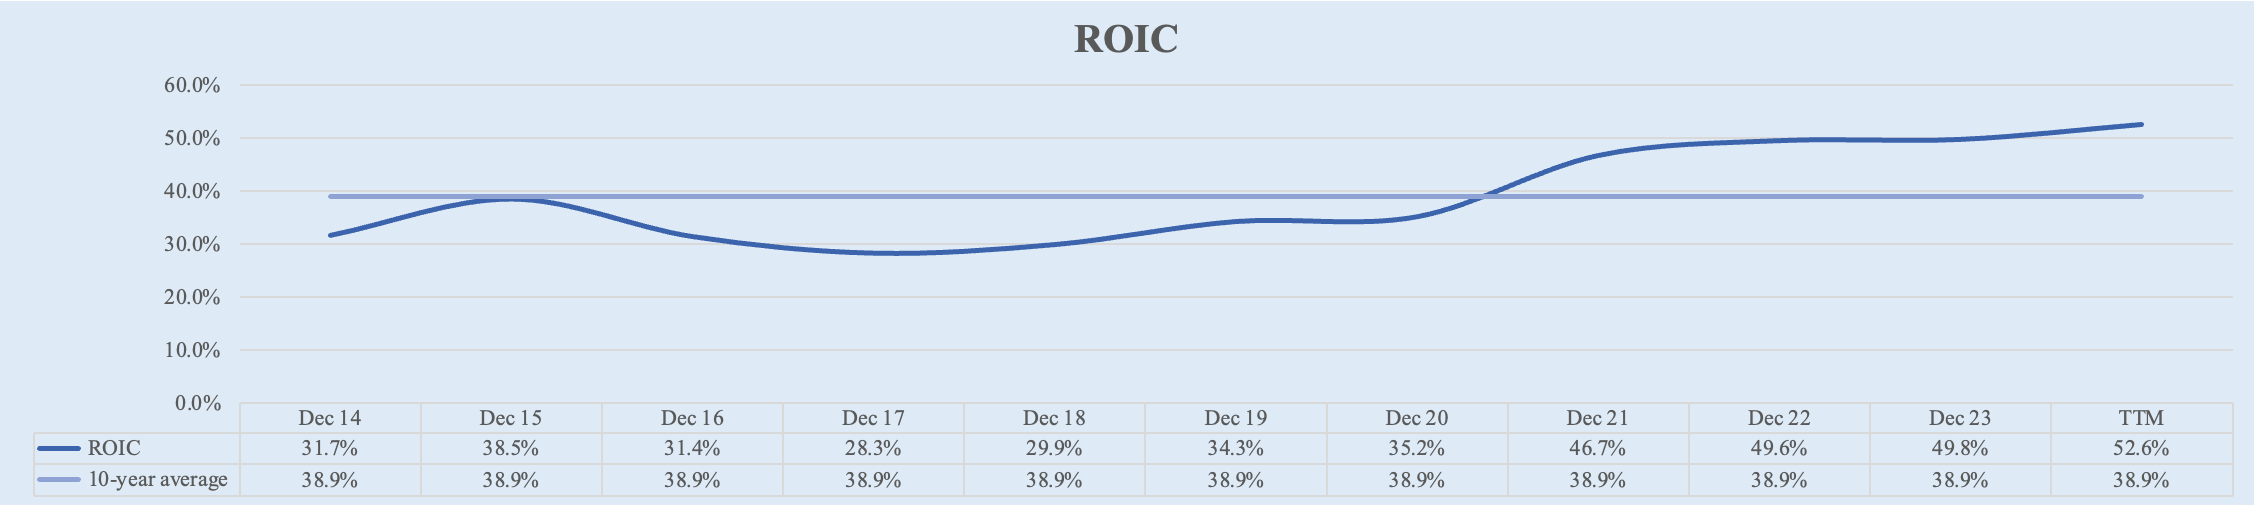
ROIC
Apple's return on invested capital (ROIC) is truly impressive, showcasing the company's exceptional business performance. Starting at 31.7% in FY 2014, Apple’s ROIC climbed to 49.8% by FY 2023. Over the trailing twelve months (TTM), Apple’s ROIC has further increased to an outstanding 52.6%. Wow!
FY 2014: 31.7%
FY 2023: 49.8%
TTM: 52.6%
5-Year Average: 44.7%
10-Year Average: 38.9%
Rating: 5
Key Profitability Drivers:
1. Premium Pricing Strategy
Apple's products are positioned as premium items in the market, allowing the company to charge higher prices compared to competitors. The strong brand loyalty and perception of superior quality enable Apple to maintain premium pricing across its product lines, which directly contributes to higher profit margins.
2. Economies of Scale
As one of the largest technology companies in the world, Apple benefits significantly from economies of scale. High sales volumes allow Apple to negotiate better terms with suppliers and spread fixed costs over a larger number of units, reducing per-unit costs and improving margins.
3. In-House Silicon and Vertical Integration
The development of in-house silicon, such as the M1, M2 and M3 chips, has allowed Apple to integrate hardware and software more tightly, resulting in better performance and efficiency. This vertical integration reduces dependency on external suppliers and captures more value within the company, leading to higher margins.
4. High-Margin Services Segment
As mentioned above, Apple has successfully expanded its services segment, which typically has higher margins than hardware because they involve lower production and distribution costs. The recurring revenue model of subscription services also provides a steady and profitable income stream.
5. Operational Efficiency and Supply Chain Management
Apple’s sophisticated supply chain management and operational efficiencies have played a crucial role in maintaining high margins. By optimizing logistics, manufacturing processes, and inventory management, Apple minimizes waste and reduces costs. This operational excellence allows Apple to maintain high profitability despite competitive pressures.
6. Product Mix and Accessories
Apple’s strategy of upselling accessories and add-ons like AirPods, Apple Watch, and premium cases also contributes to higher margins. These accessories often carry higher profit margins than the core products and complement Apple's ecosystem, encouraging further purchases from existing customers.
Third Dimension: Solvency 💸
Debt / Equity
Apple's debt to equity ratio has seen a notable increase over the past decade. It rose from 0.32 in FY 2014 to 1.79 in FY 2023. However, over the trailing twelve months (TTM), this ratio has decreased to 1.41, reflecting a more balanced and healthy leverage level for the company.
FY 2014: 0.32
FY 2023: 1.79
TTM: 1.41
5-Year Average: 1.74
10-Year Average: 1.27
Rating: 3
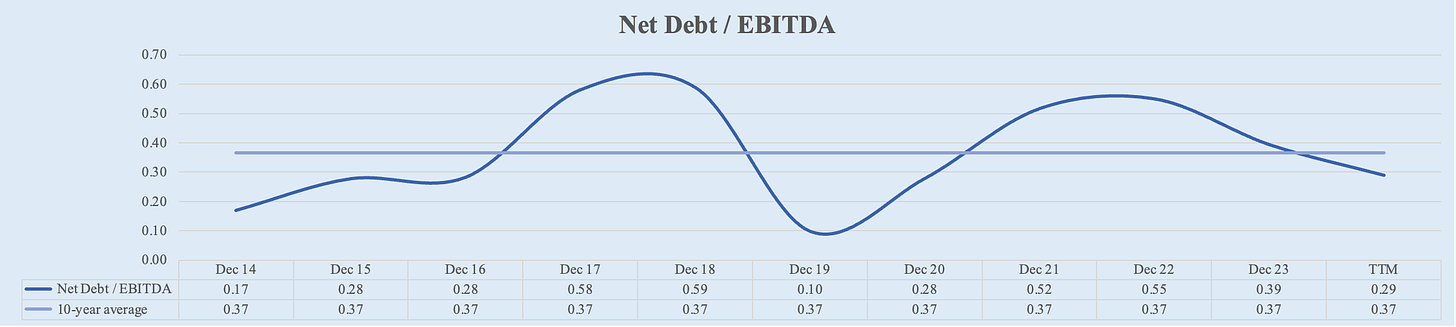
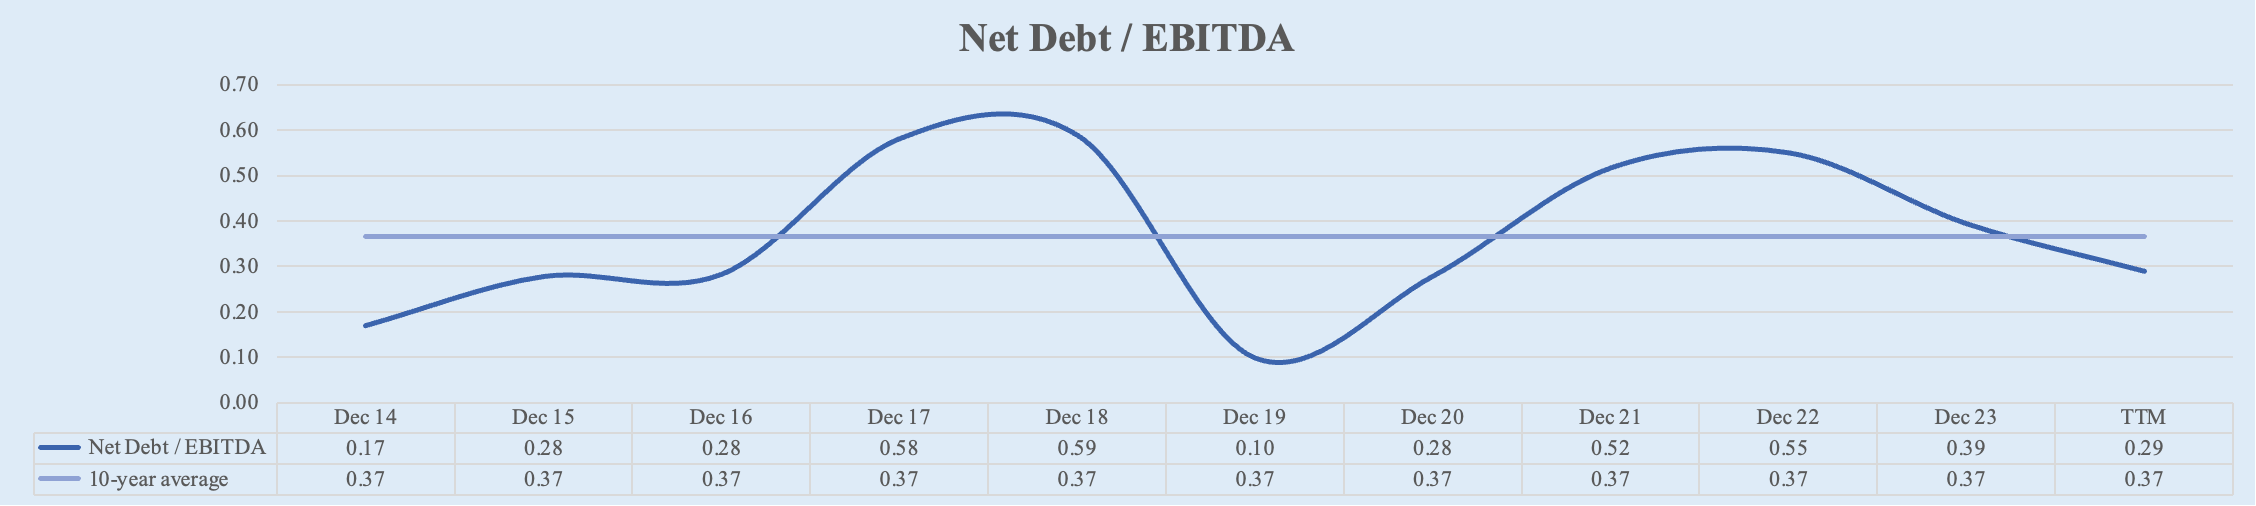
Net Debt / EBITDA
Comparing Apple's cash position of $67.2 billion with its total debt of $112.7 billion, the company holds a net debt position of $45.5 billion. Despite this net debt, Apple's net debt to EBITDA ratio over the last twelve months (LTM) stands at a very secure 0.29. Over the past five years, Apple has maintained an average net debt to EBITDA ratio of 0.35, and over the past ten years, this average has been 0.37. This demonstrates Apple's effective management of its debt relative to its earnings, ensuring strong financial stability.
FY 2014: 0.17
FY 2023: 0.39
TTM: 0.29
5-Year Average: 0.35
10-Year Average: 0.37
Rating: 5
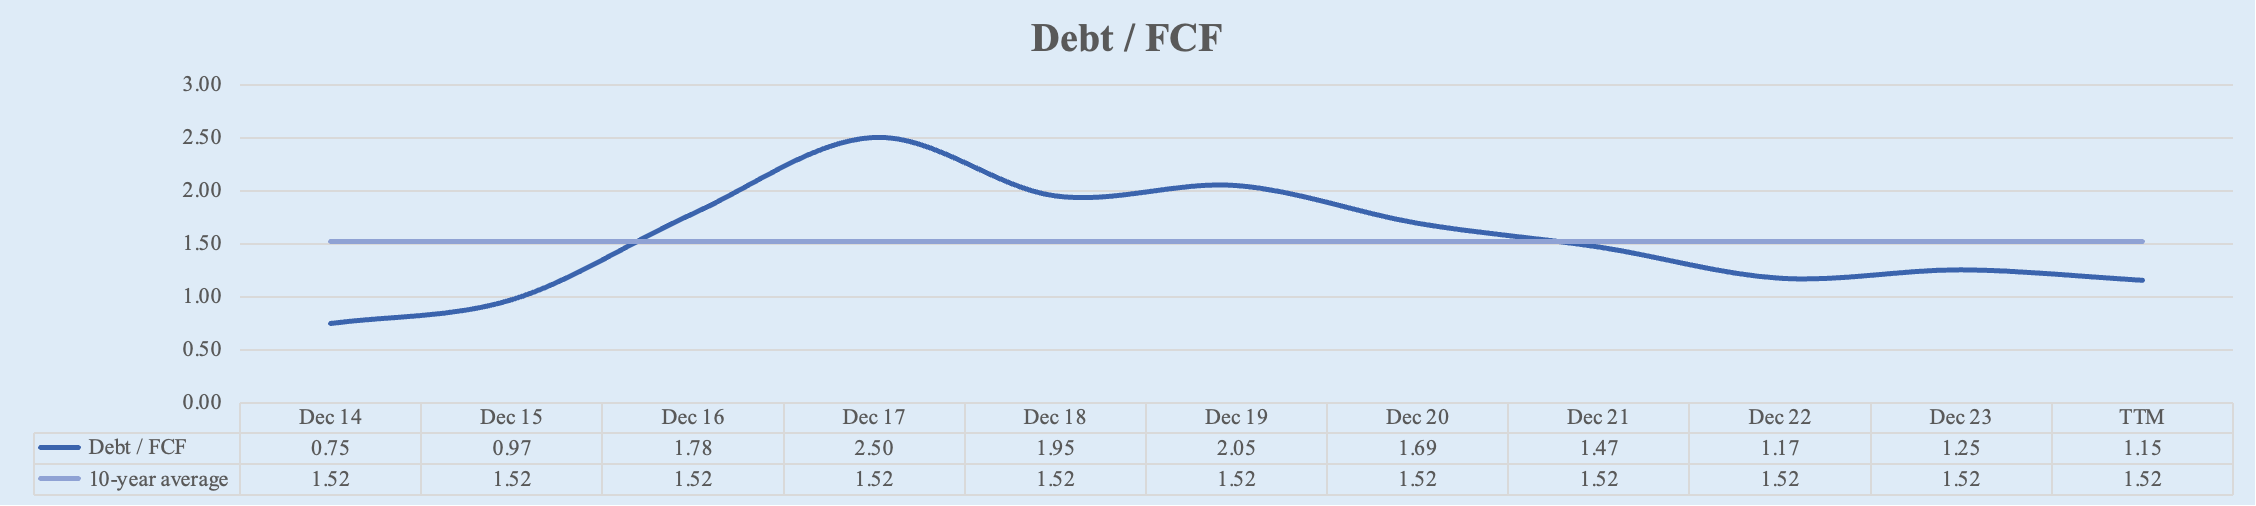
Debt / FCF
Apple's current debt to free cash flow ratio is at 1.15. This indicates that Apple could pay off all its debt using just 1.15 years' worth of free cash flows. That’s crazy!
FY 2014: 0.75
FY 2023: 1.25
TTM: 1.15
5-Year Average: 1.46
10-Year Average: 1.52
Rating: 5
Fourth Dimension: Valuation 📈
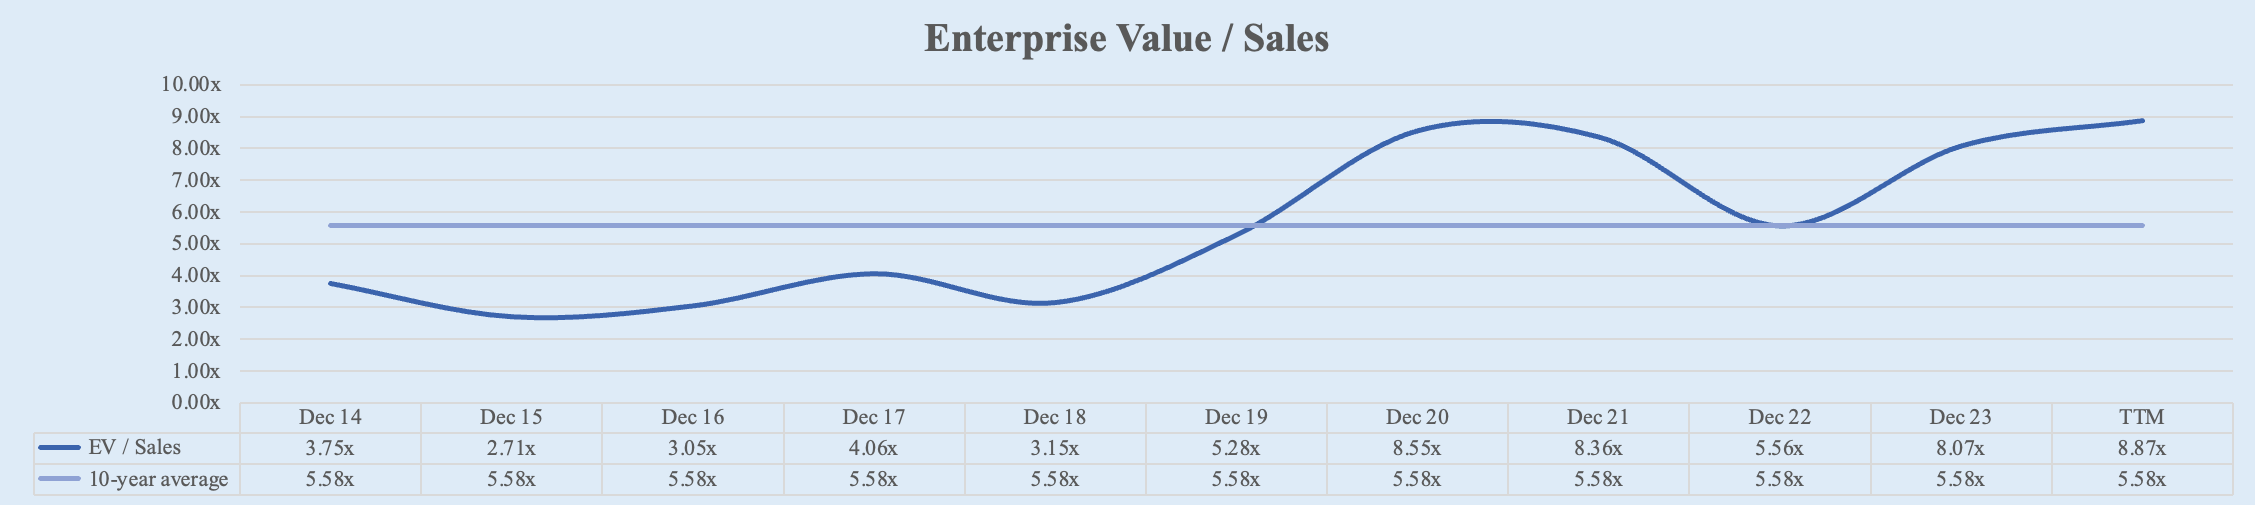
EV / Sales
Apple's EV/Sales ratio has increased significantly over the past decade. Starting from 3.75x in FY 2014, it increased to 8.07x in FY 2023. Over the TTM, Apple’s EV/Sales ratio further increased to 8.66x. This means that Apple never was so expensive relative to its sales! That’s how much the market is anticipating Apple’s Intelligence presented in last June 10th in WWDC.
Apple's EV/Sales ratio has increased significantly over the past decade. Starting from 3.75x in FY 2014, it rose to 8.07x in FY 2023. Over the TTM, this ratio further climbed to 8.66x. This means that Apple has never been so expensive relative to its sales, reflecting market anticipation and excitement about the recent announcement of Apple Intelligence.
During the WWDC 2024 held on June 10th, Apple introduced "Apple Intelligence," a new AI system integrated into iOS 18, iPadOS 18, and macOS Sequoia. This system, powered by a combination of Apple’s technology and OpenAI's ChatGPT, aims to enhance user experience through advanced AI capabilities.
FY 2014: 3.75x
FY 2023: 8.07x
TTM: 8.66x
5-Year Average: 7.41x
10-Year Average: 5.56x
Rating: 2
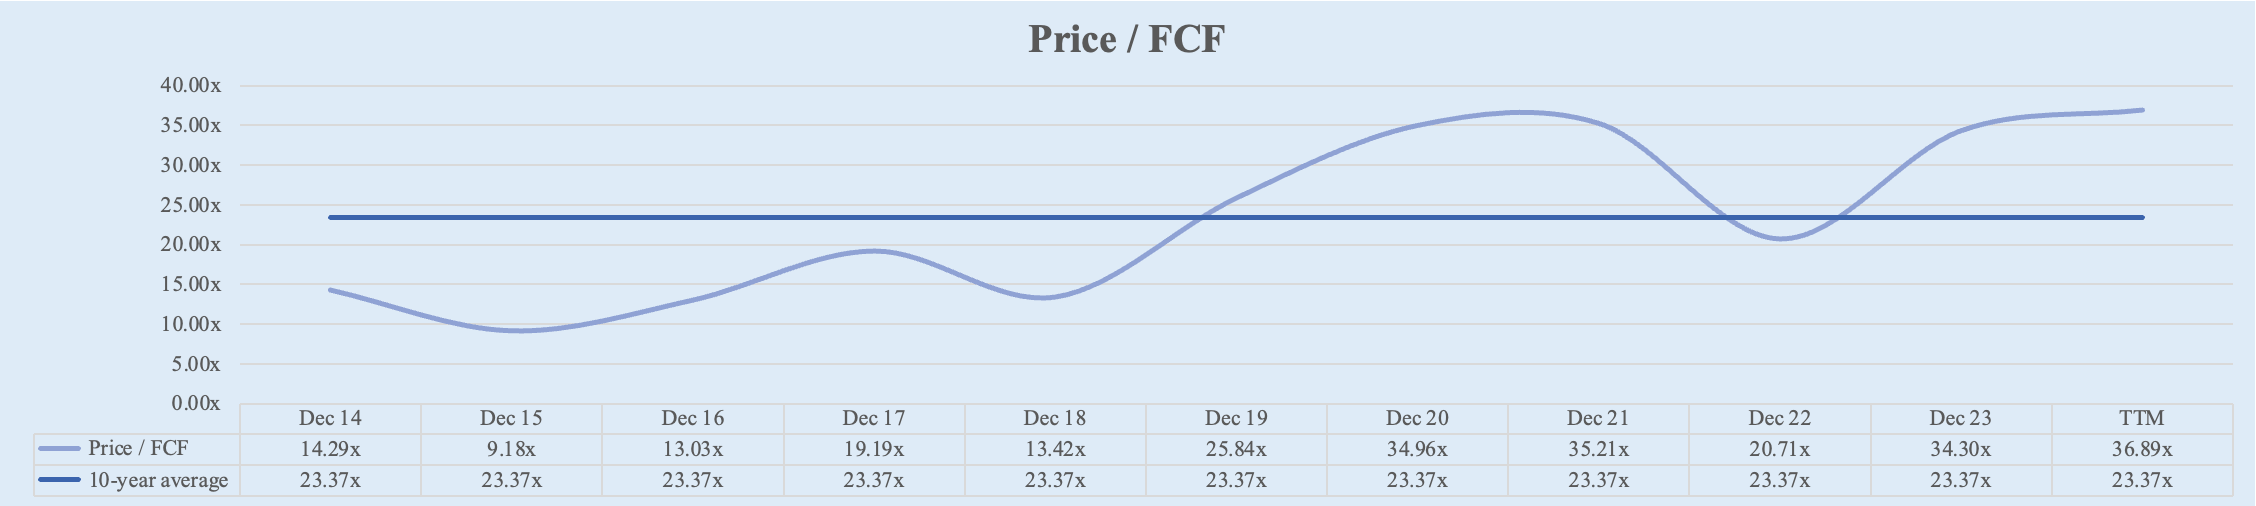
Price / FCF
Similar to EV/Sales ratio, Apple's Price/FCF ratio has increased significantly over the past decade. Starting from 14.29x in FY 2014, it increased to 34.30x in FY 2023, more than double. Over the TTM, Apple’s Price/FCF ratio further increased to 36.0x.
FY 2014: 14.29x
FY 2023: 34.30x
TTM: 36.0x
5-Year Average: 31.17x
10-Year Average: 23.29x
Rating: 1
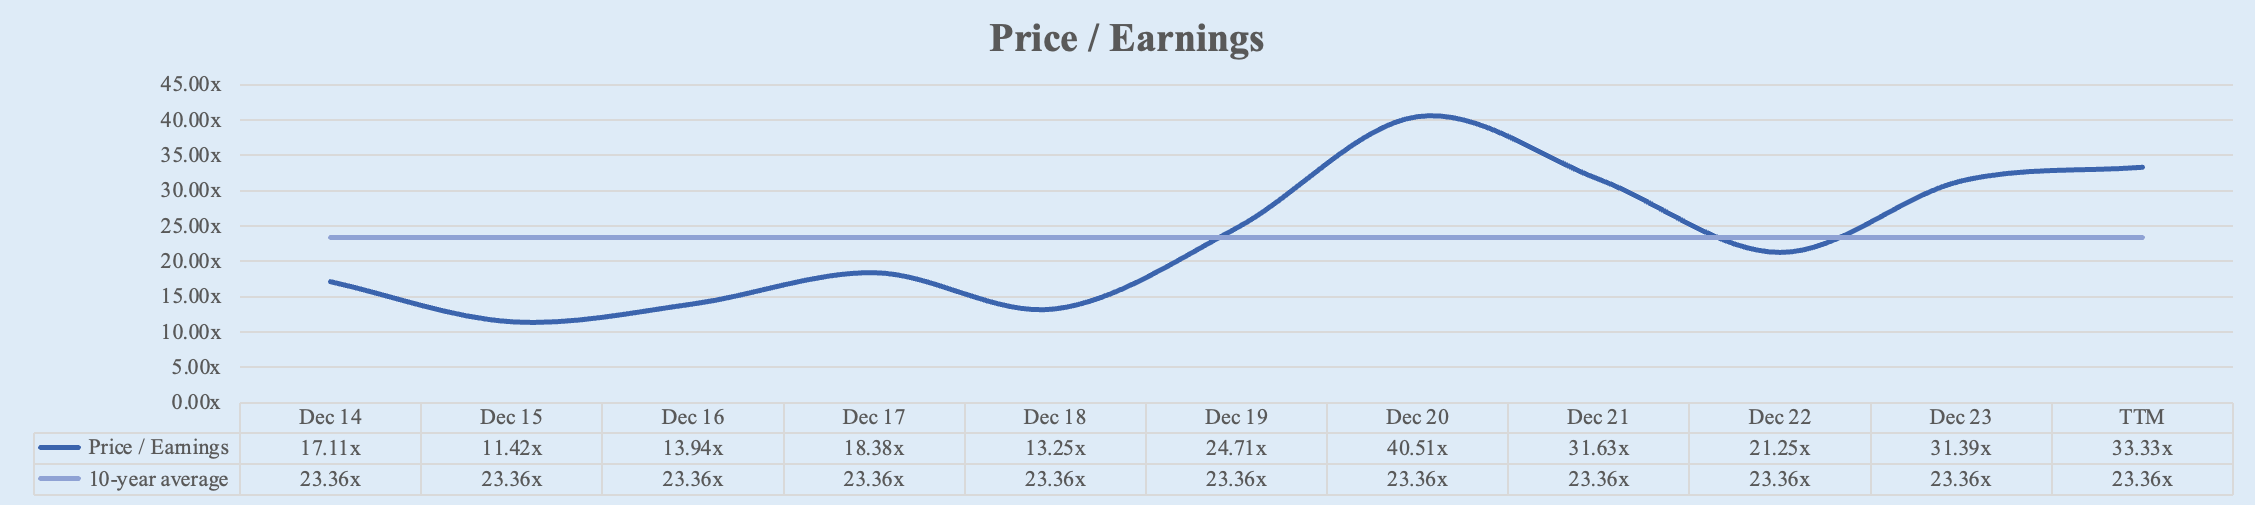
Price / Earnings
Similarly, Apple's Price/Earnings ratio has also increased significantly over the past decade. Starting from 17.11x in FY 2014, it increased to 32.53x over the TTM.
FY 2014: 17.11x
FY 2023: 31.39x
TTM: 32.53x
5-Year Average: 30.34x
10-Year Average: 23.28x
Rating: 2
Fifth Dimension: Shareholders Return 💵
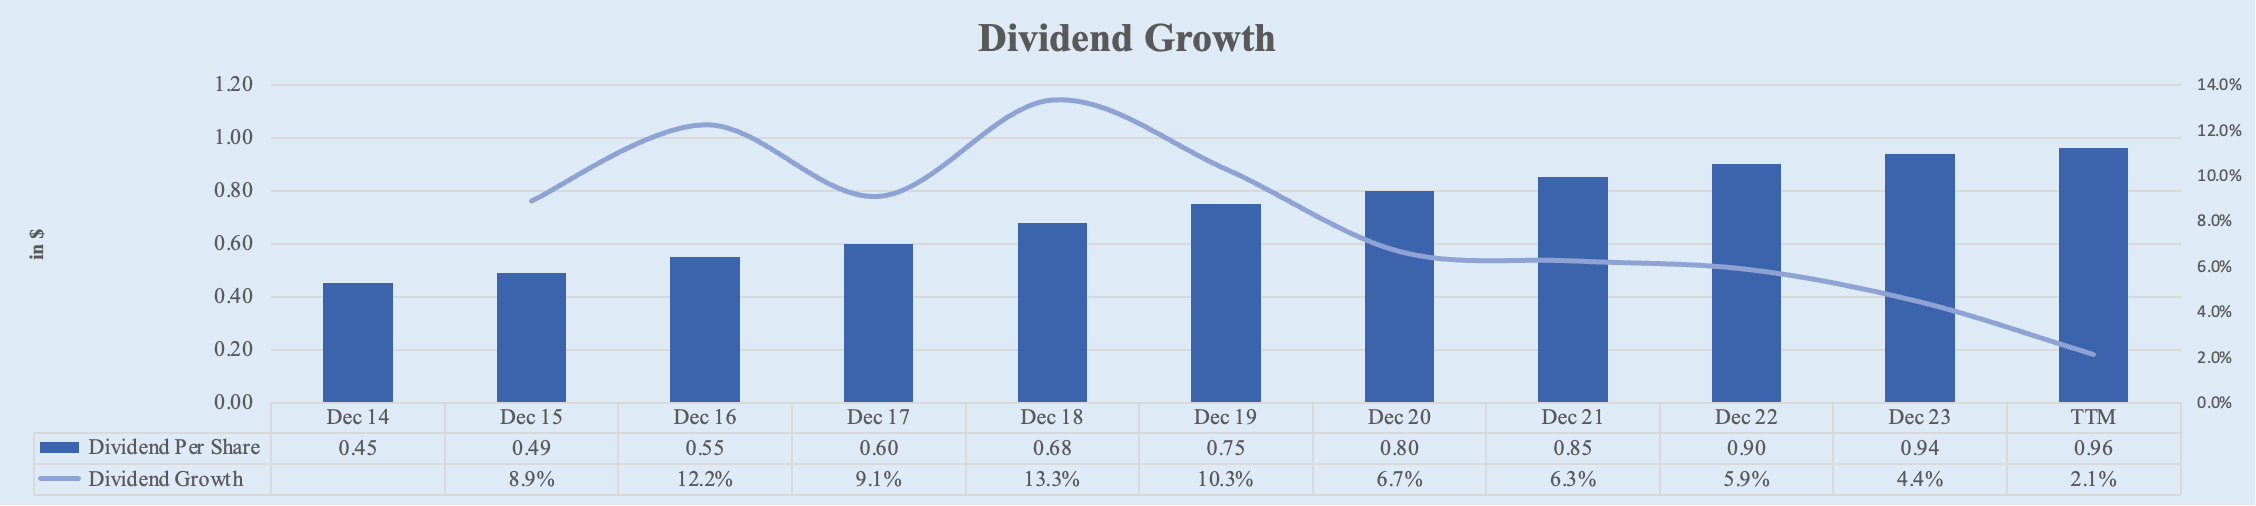
Dividend Growth
Apple's dividends have exhibited robust growth over the past decade. Beginning at $0.45 per share in FY 2014, dividends have more than doubled to the current $0.96 per share. This translates to a 5-year CAGR of 7.1% and a 10-year CAGR of 7.9%, the kind of growth that every dividend investor wants.
FY 2014: $0.45
FY 2023: $0.94
TTM: $0.96
5-Year CAGR: 7.1%
10-Year CAGR: 7.9%
Rating: 4
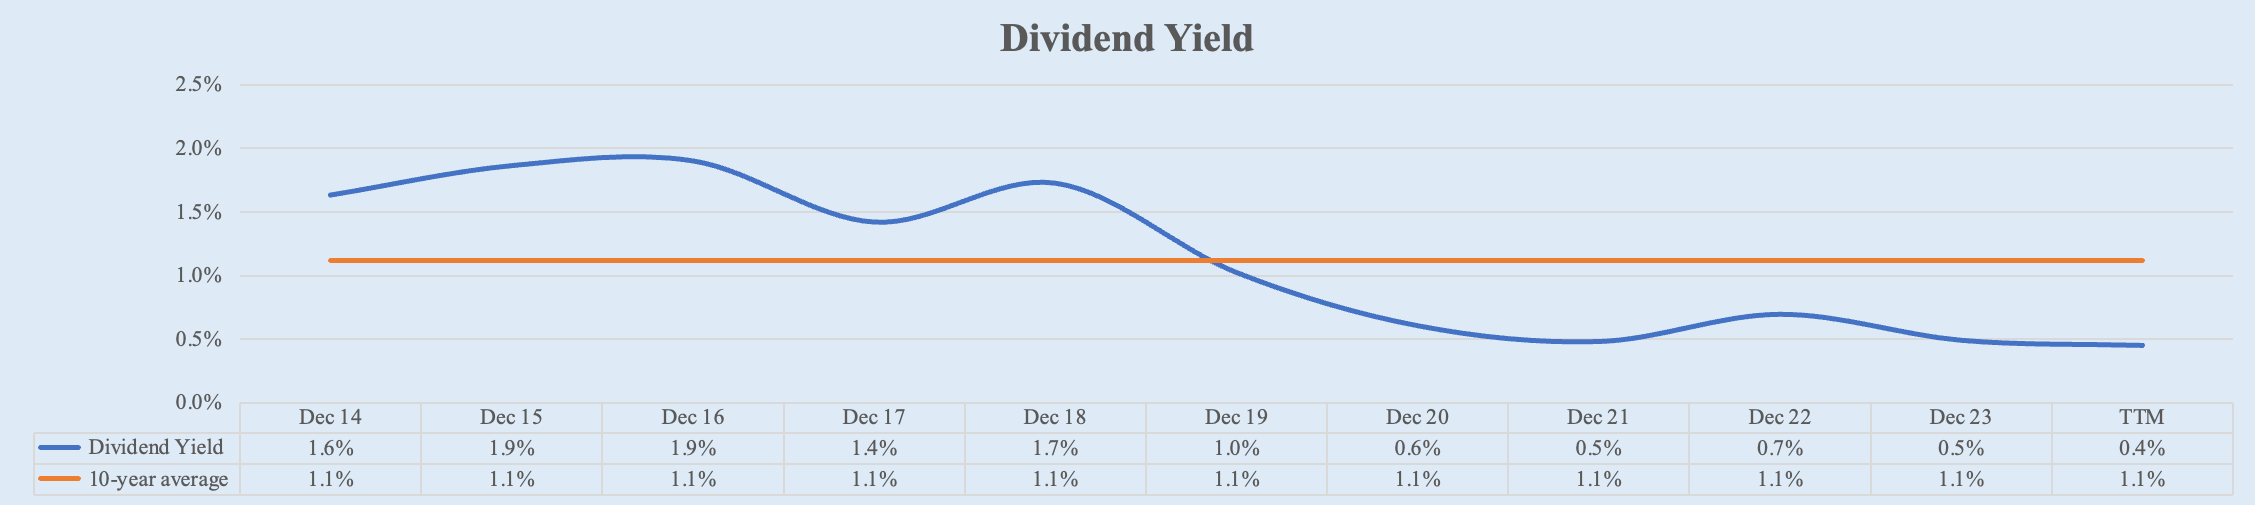
Dividend Yield
On the other hand, Apple's dividend yield has decreased over the past decade due to the faster appreciation in stock price than dividend increases. Starting from 1.6% in FY 2014, it decreased to 0.4% over the LTM.
Conversely, Apple's dividend yield has declined over the past decade due to the stock price appreciating faster than dividend increases. Starting from 1.6% in FY 2014, the dividend yield has decreased to 0.4% over the LTM. This decline reflects the substantial growth in Apple's stock price, which has outpaced the rate of dividend growth.
FY 2014: 1.6%
FY 2023: 0.5%
TTM: 0.4%
5-Year Average: 0.6%
10-Year Average: 1.1%
Rating: 1
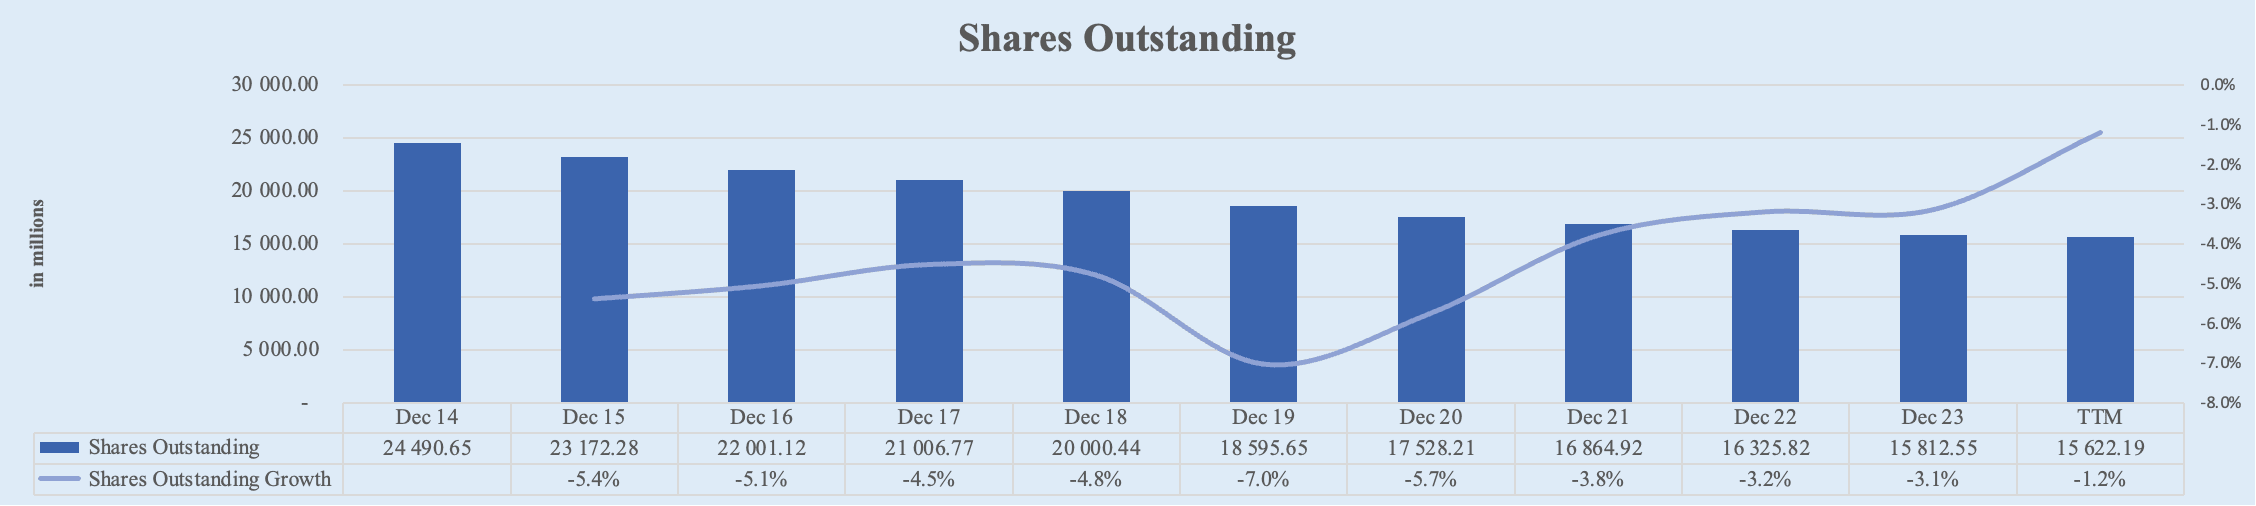
Shares Outstanding
Now onto one of the most important metrics: Apple's shares outstanding have significantly decreased over the past decade. Starting from 24,490.65 million shares in FY 2014, the number of shares decreased to 15,812.55 million in FY 2023. Over the LTM, Apple’s shares outstanding further decreased to 15,622.19 million. This represents a 5-year CAGR of -3.8% and a 10-year CAGR of -4.0%. Just look at the magnitude of this: Apple bought back almost 10 billion shares over the last decade, reducing more than 1/3 of the shares outstanding. That’s remarkable!
FY 2014: 24,490.65M
FY 2023: 15,812.55M
TTM: 15,622.19M
5-Year CAGR: -3.8%
10-Year CAGR: -4.0%
Rating: 5
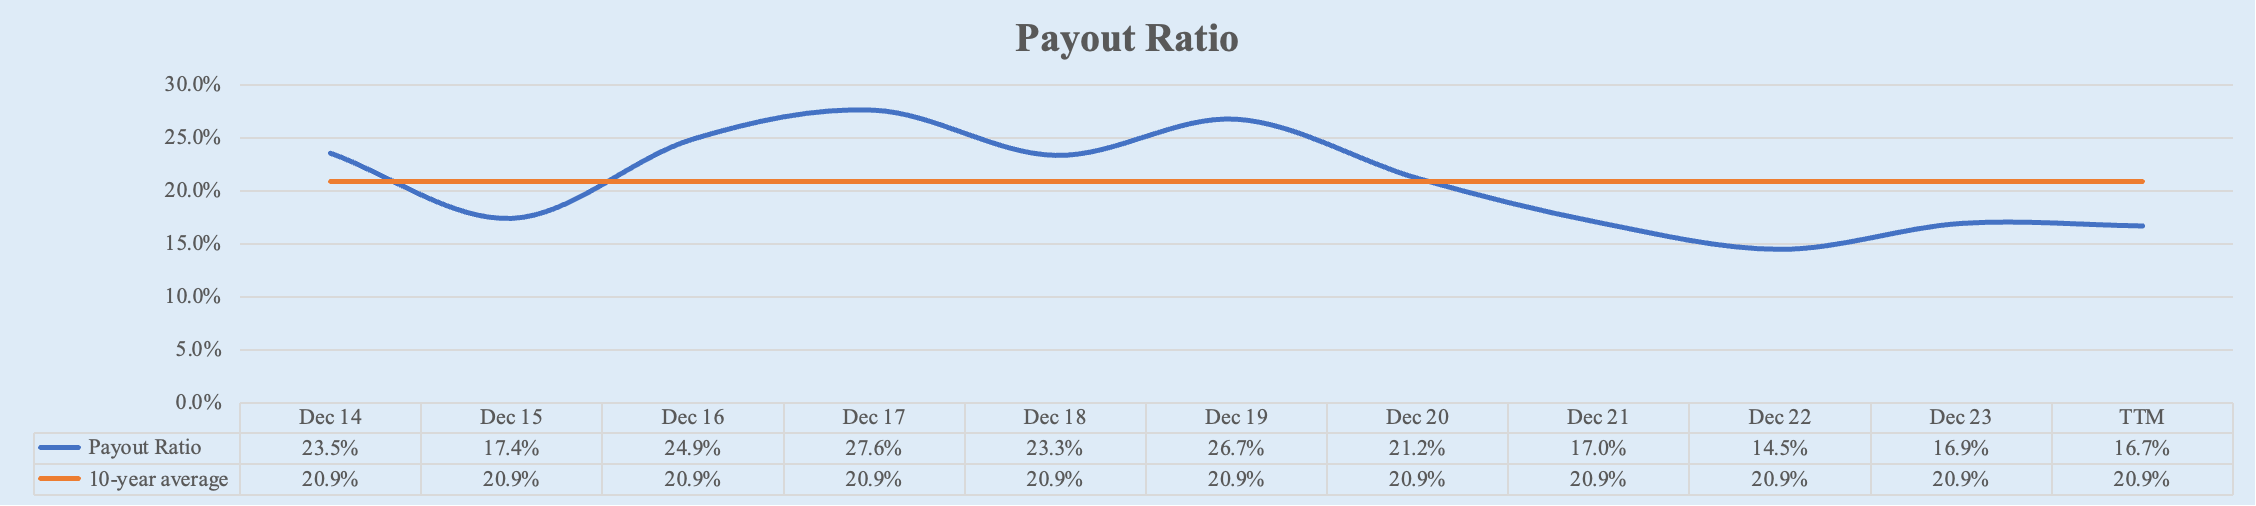
Payout Ratio
Looking into Payout Ratio, we see that Apple's dividends are more than safe! Starting from 24% in FY 2014, it decreased to 17% over the TTM.
FY 2014: 24%
FY 2023: 17%
TTM: 17%
5-Year Average: 17%
10-Year Average: 20.9%
Rating: 5
Five Dimensions Summary:
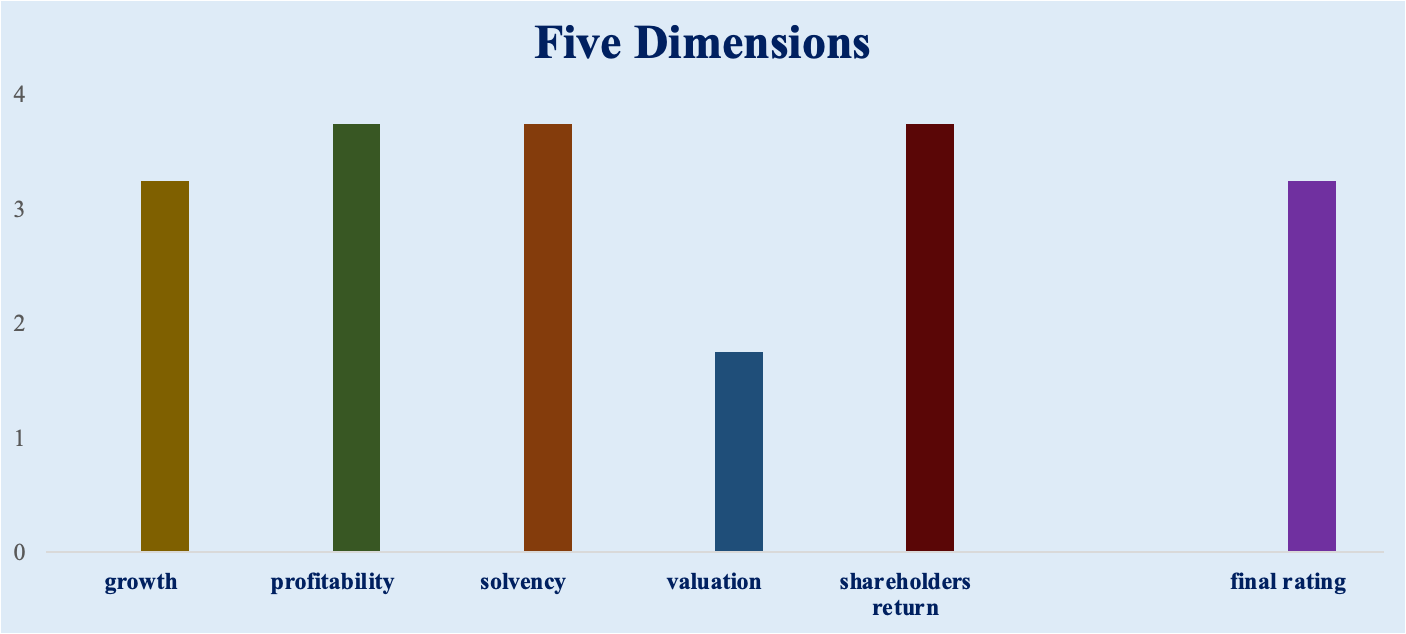
Growth: 3.3
Profitability: 3.8
Solvency: 3.8
Valuation: 1.8
Shareholders Return: 3.8
Final Rating: 3.3
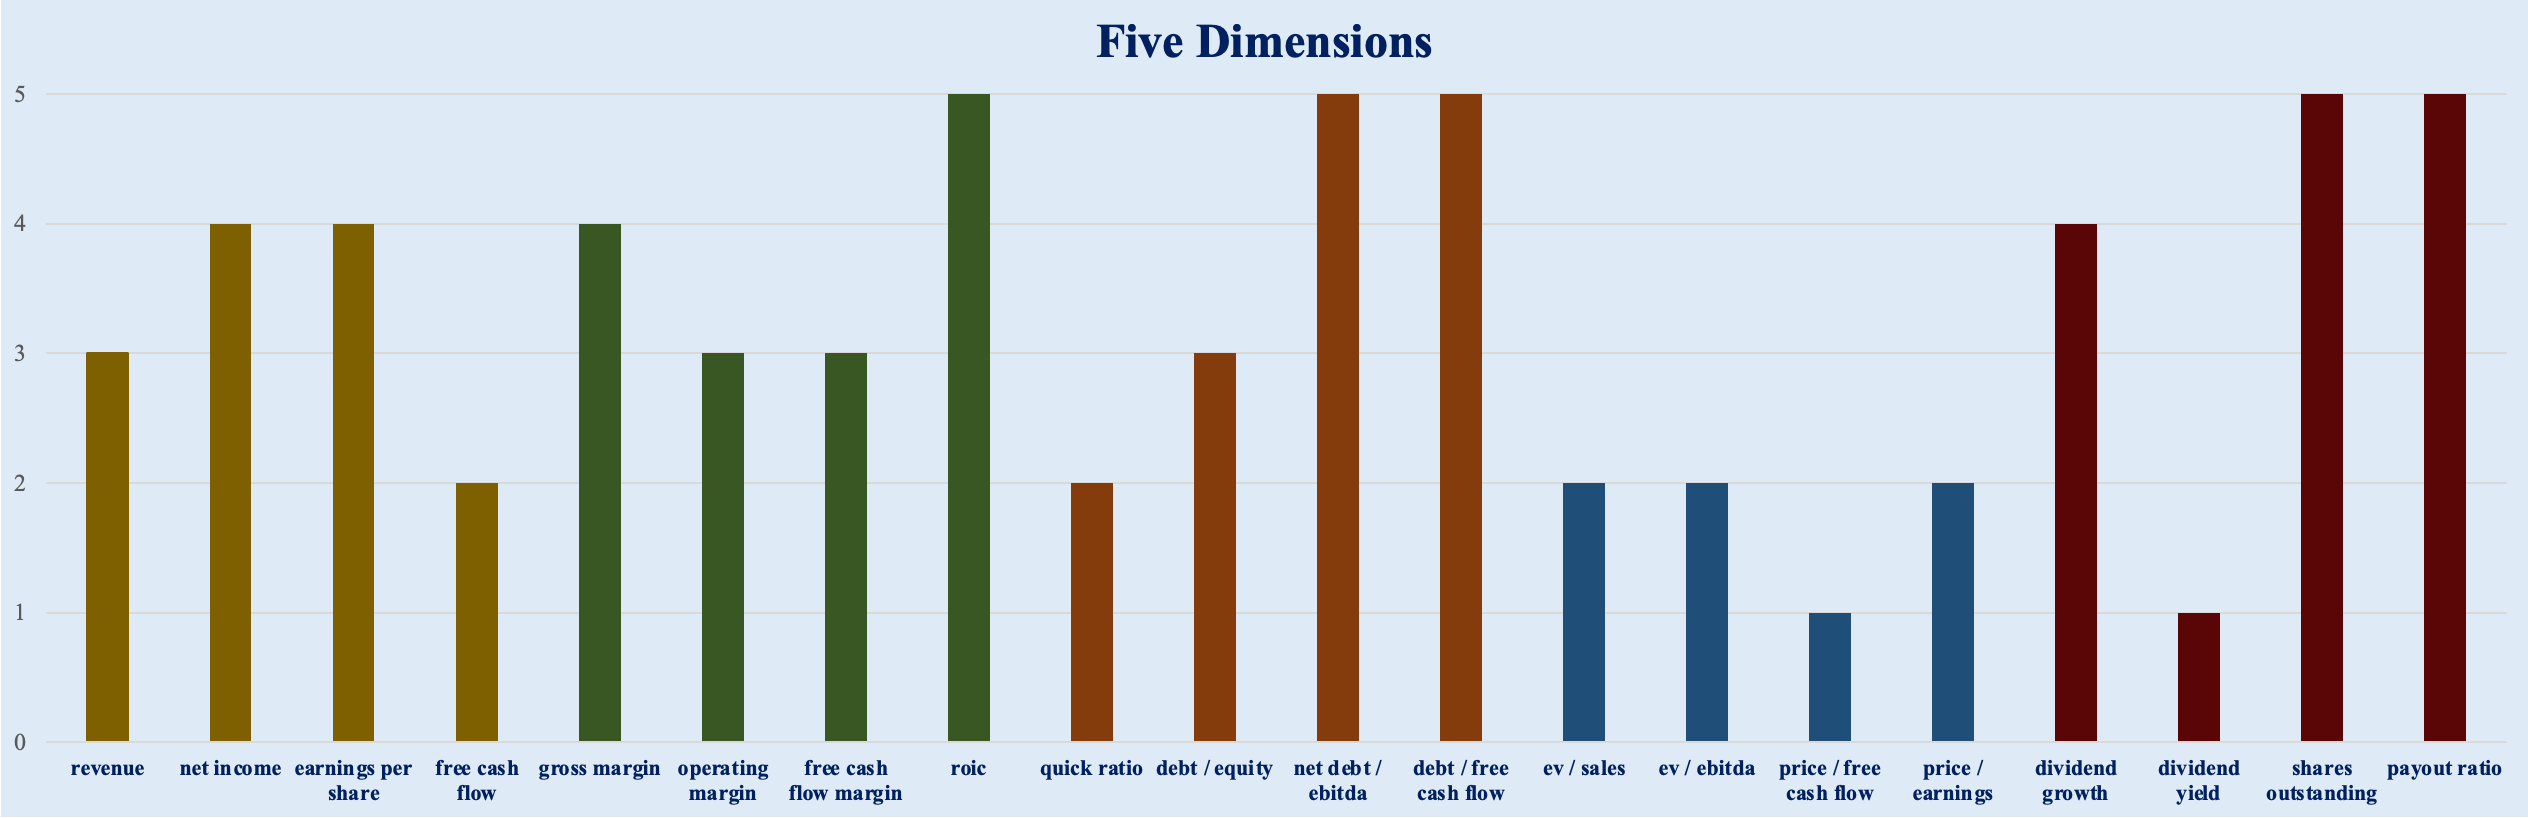
Positive Metrics:
Net Income, EPS (Ratings: 4): Significant improvement in profits and EPS.
ROIC (Rating: 5): Strong return on invested capital.
Net Debt / EBITDA, Debt / FCF (Rating: 5): Low leverage.
Shares Outstanding (Rating: 5): More than 1/3 reduction in share count.
Payout Ratio (Rating: 5): Stable and sustainable payout ratio.
Negative Metrics:
EV/Sales, EV/EBITDA (Ratings: 2): High valuation multiples relative to historical averages.
Price / FCF, Price / Earnings (Ratings: 1): High valuation multiples relative to historical averages.
Dividend Yield (Rating: 1): Substantial growth in Apple's stock price, which has outpaced the rate of dividend growth leading to a lower dividend yield.
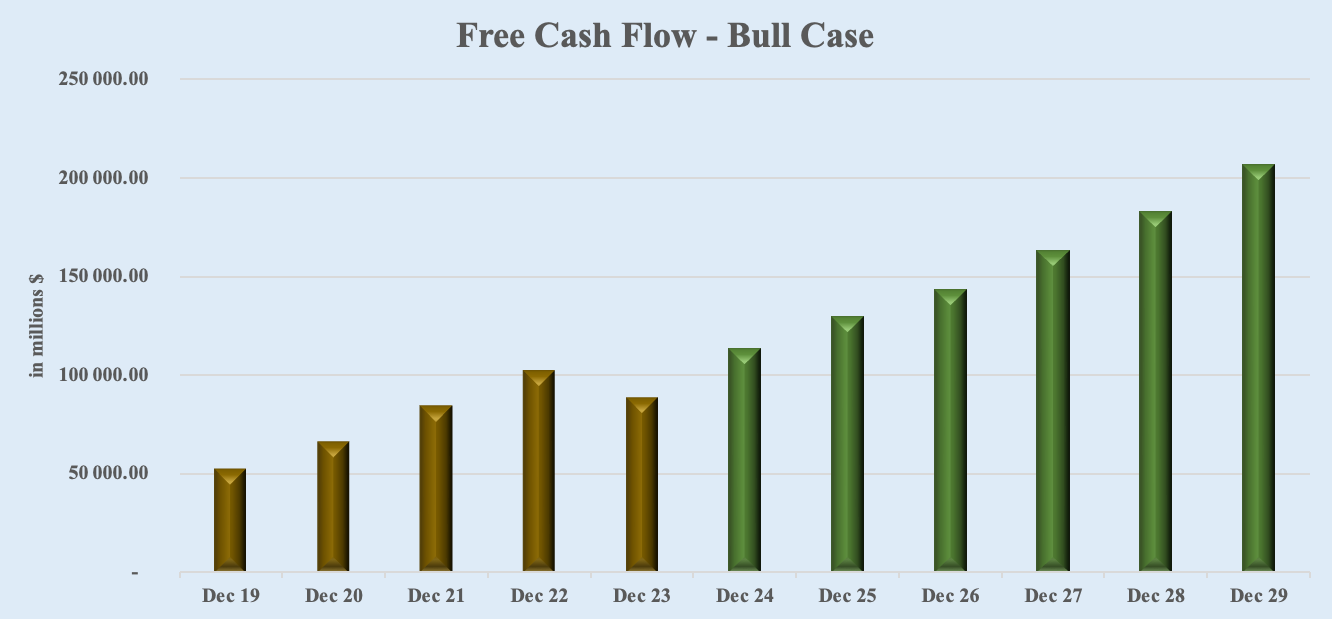
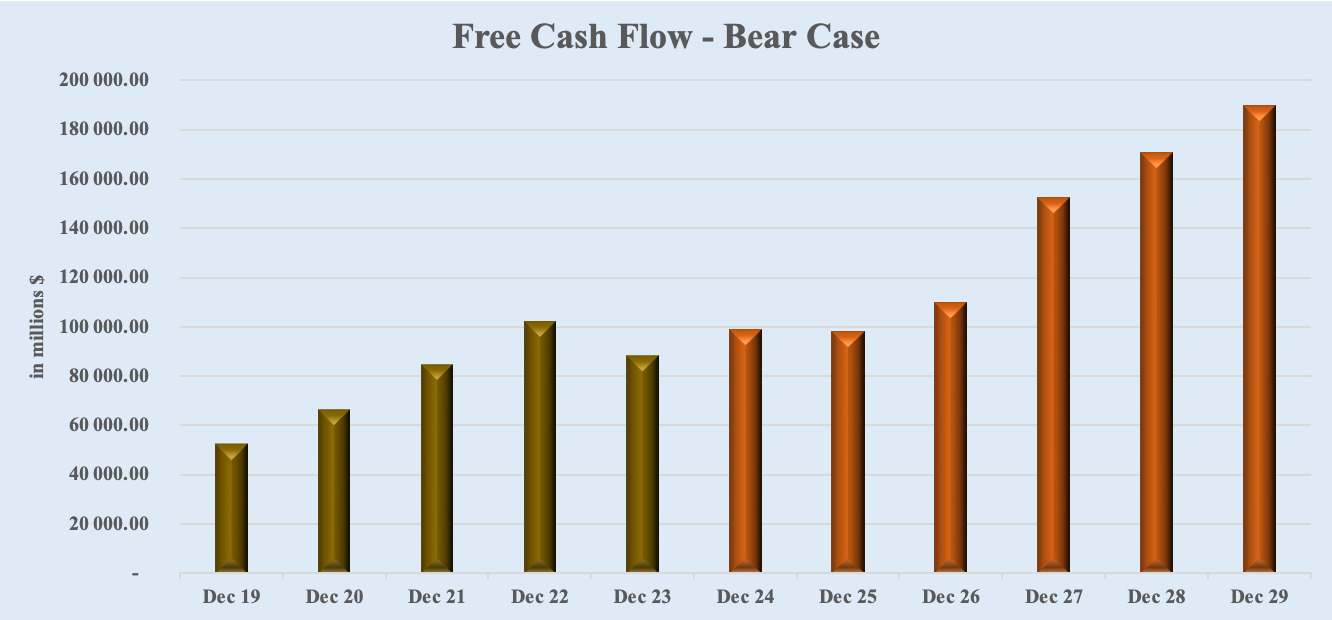
II. DCF Valuation
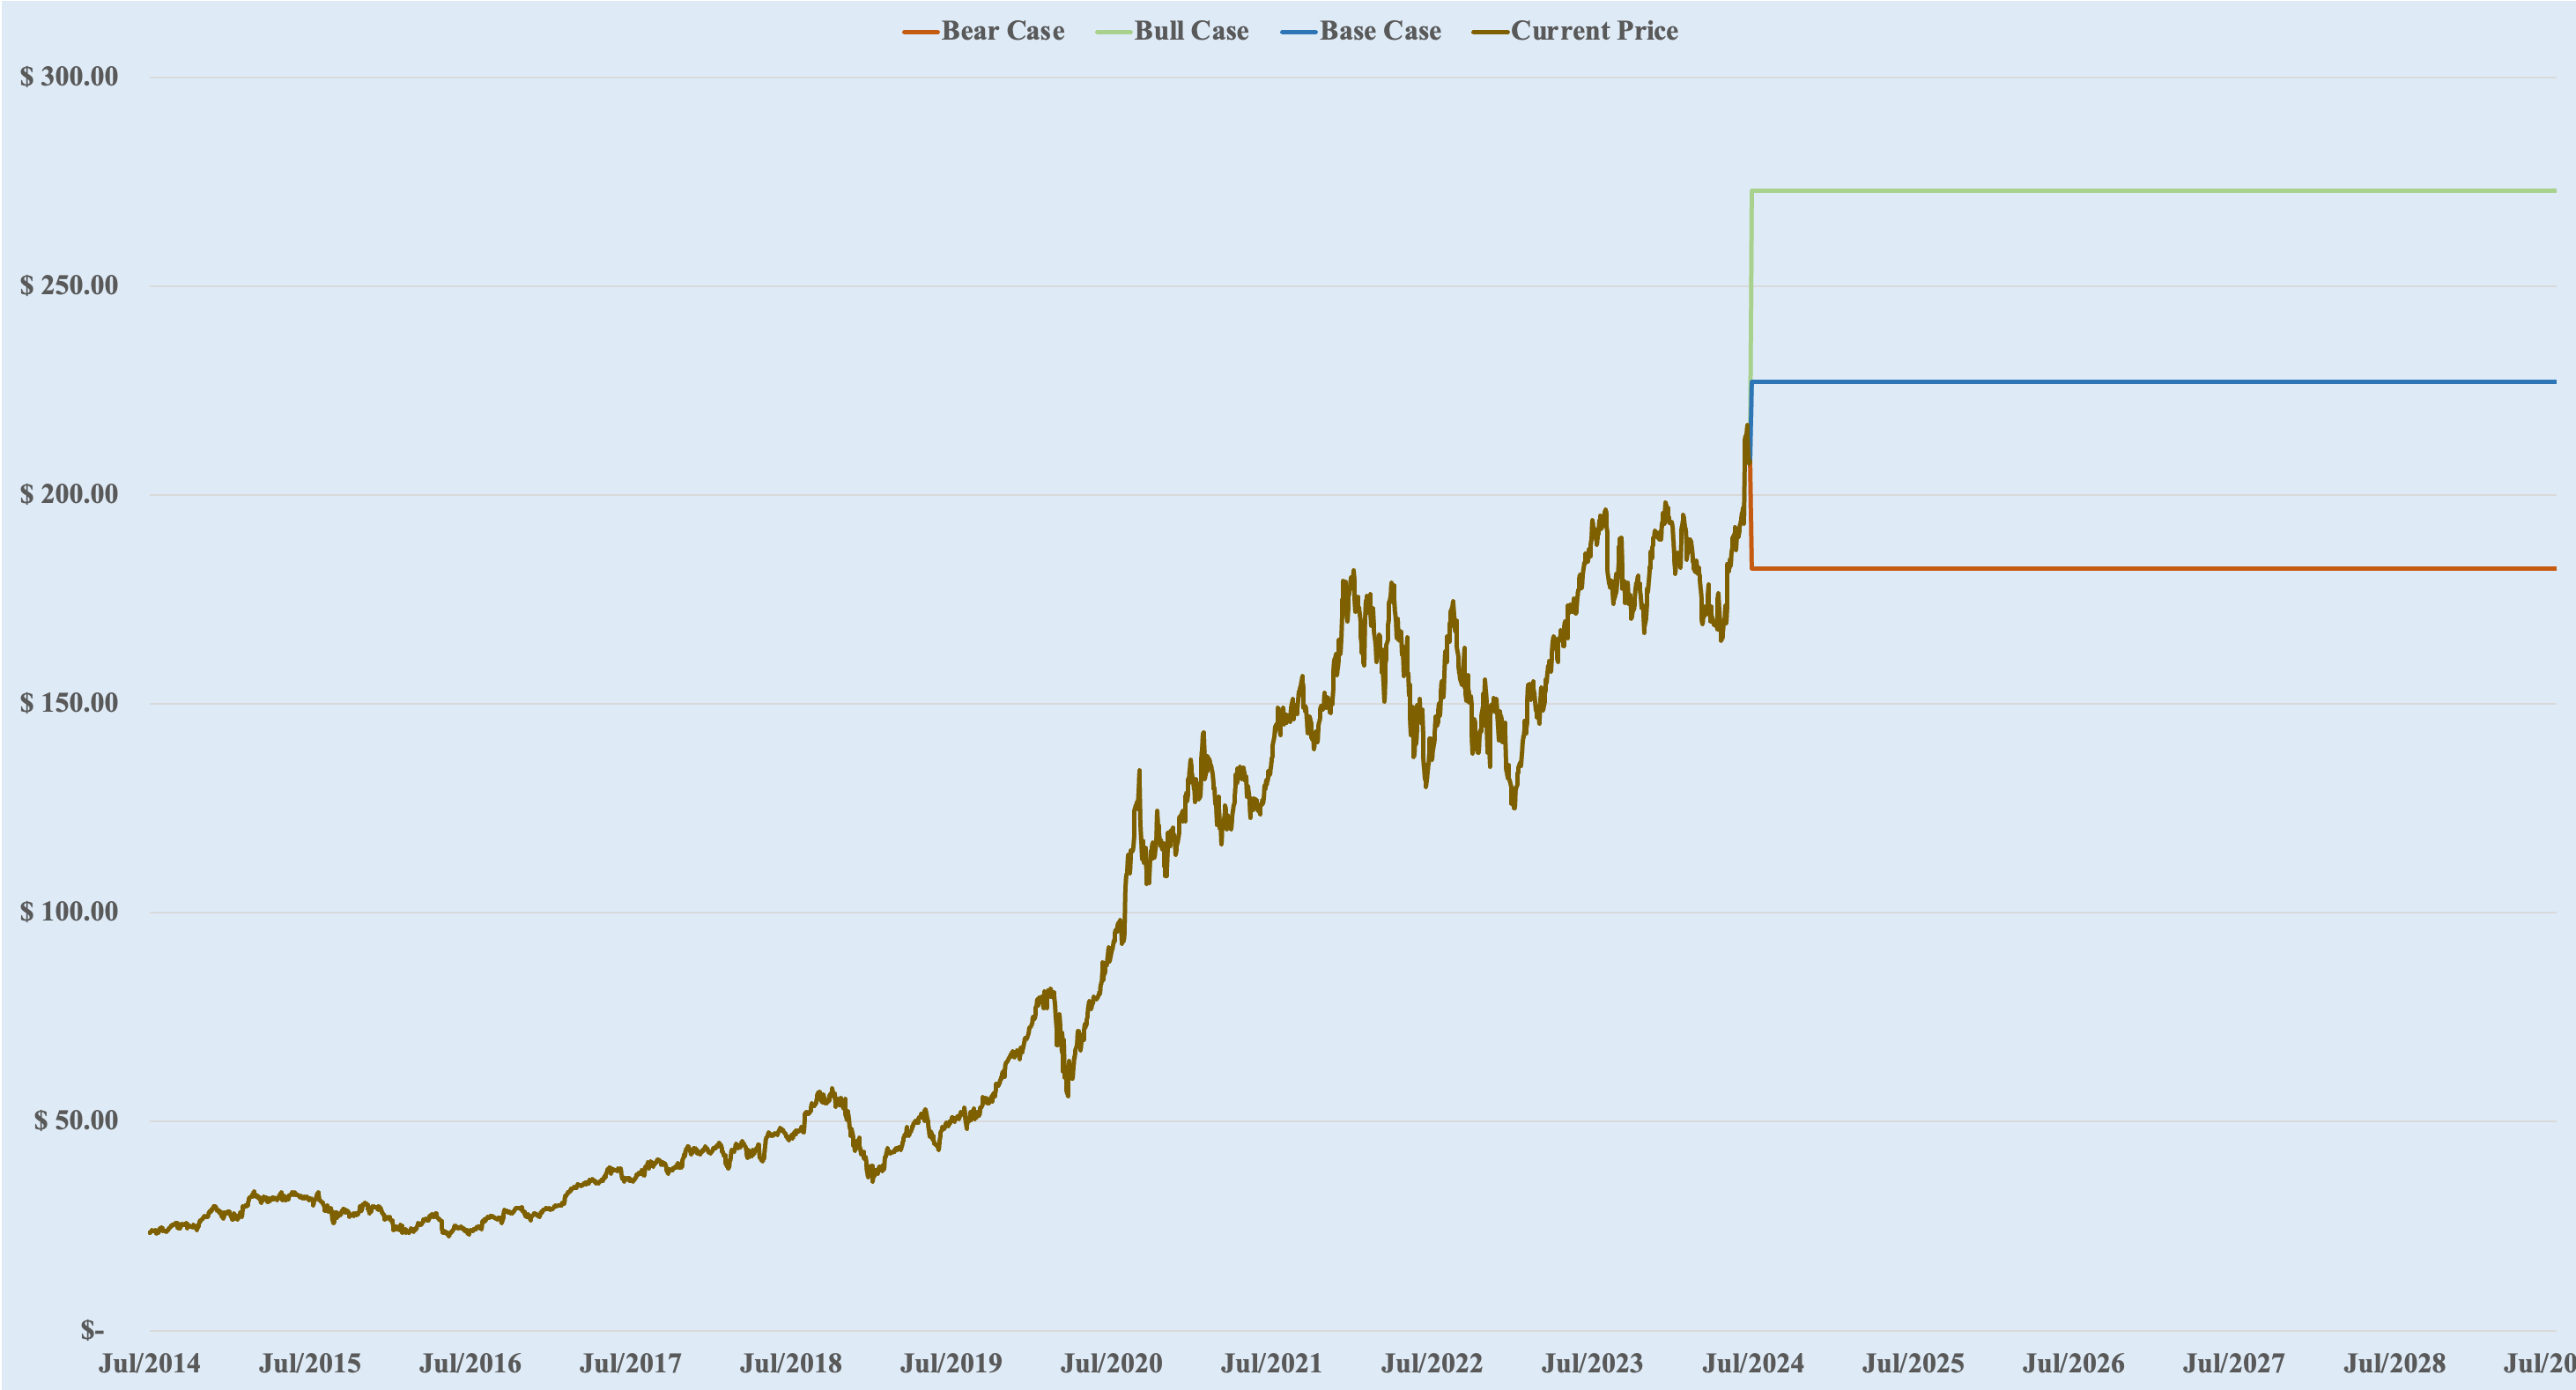
I employ Wall Street analysts' free cash flow projections to compute Apple’s fair value. The average estimates of the next 5 years are utilized for a Base Case scenario, the highest estimates for a Bull Case scenario, and the lowest estimates for a Bear Case scenario.
Base Case: $227, 8.6% above the current price, meaning Apple is slightly undervalued.
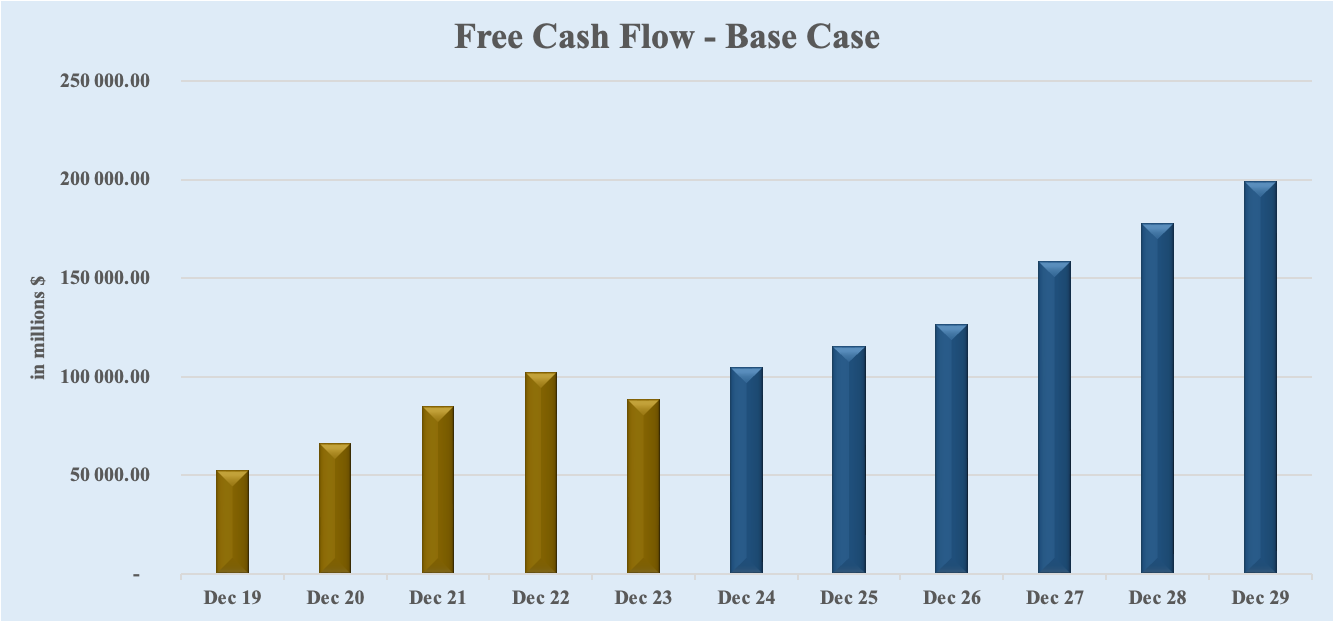
Bull Case: $273, 30.5% above the current price, meaning Apple is undervalued.
Bear Case: $182, -12.8% below the current price, meaning Apple is overvalued.
Weighted Average Price Target: $227, implying a 6.3% undervaluation.
III. Final Summary
Apple is an industry titan, one of the best businesses globally, and this analysis confirms that. The company demonstrates robust growth, increasing profitability, strong financial health, and a commitment to shareholder returns through higher dividends and significant share buybacks. Several tailwinds have driven this success:
Product Innovation: Continuous innovation in product lines, including the iPhone, iPad, Mac, and new categories like wearables and accessories.
Services Segment Growth: Expanding high-margin services like Apple Music, Apple TV+, and the App Store.
Brand Loyalty and Ecosystem: Strong customer loyalty and a seamless ecosystem that integrates hardware, software, and services.
Global Market Penetration: Strategic expansion into emerging markets such as China and India.
Additionally, Apple has several drivers going into the future:
Main Drivers for the Future
Advancements in AI and Machine Learning: The introduction of "Apple Intelligence" and partnerships with companies like OpenAI to integrate AI capabilities into Apple products are expected to drive future growth. These innovations will enhance user experience and create new market opportunities!
Expansion into New Markets and Segments: Continued efforts to penetrate new geographical markets and segments, especially in developing countries, will be crucial. Strategies to offer more affordable product variants while maintaining premium offerings will help capture a broader customer base.
Services and Subscription Models: Expanding the services segment with new offerings and enhancing existing ones will continue to be a major growth driver. .
However, every business has its risks:
Main Risks
Intense Competition: Apple faces fierce competition from other technology giants such as Samsung, Google, and Microsoft. Keeping ahead in innovation and maintaining market share in a rapidly evolving industry is a constant challenge.
Regulatory and Legal Challenges: Apple is subject to numerous regulatory and legal challenges worldwide (we just saw that Apple will withhold Apple Intelligence from EU this year), which could impact its operations and financial performance. Issues related to antitrust regulations, patent disputes, and data privacy laws are ongoing concerns.
Supply Chain Vulnerabilities: Apple's reliance on a global supply chain exposes it to risks related to geopolitical tensions, natural disasters, and pandemics. Disruptions in the supply chain could affect production and delivery of products.
Economic Fluctuations: Changes in global economic conditions, such as trade policies, or inflation, can impact Apple's financial performance. Economic downturns can lead to reduced consumer spending on premium products like those offered by Apple.
Final Verdict: Next Round: Analysis 2.0
Given all these insights, I plan to take a closer look into Apple's business before making an investment decision. Specifically, I will:
Evaluate the Impact of AI: Assess how the recent move in AI, including the introduction of Apple Intelligence, might affect the company’s future growth prospects and whether the current increase in valuation multiples is justified.
Investigate Regulatory Challenges: Examine the potential effects of regulatory challenges on Apple’s operations and overall business strategy, considering how these might impact long-term growth and profitability.
Assess Analyst Projections: Review Wall Street analysts’ projections to determine whether they need adjustments for my DCF model assumptions.
Whenever you’re ready!
The Finance Dude is all about securing your financial future.
Whenever you're ready, here's how I can help you:
📅 Daily Updates: My take on daily macro events and earnings reports.
🗓️ Weekly Recaps: A summary of the week’s most important financial events.
📊 Stock Analyses: Access to a comprehensive library of all previously analyzed stocks and exclusive, detailed, and data-driven analysis of new stocks.
✅ Monthly Best Buys: A monthly list of the top-5 stocks for that month.
📈 Watchlist & Portfolio: Exclusive access to my current watchlist and portfolio.
⏰ Live Tracking: Receive alerts when I buy or sell a stock.
🧮 Interactive Tools: Downloadable Excel files where you can play and make your own assumptions for the valuation of the stocks I analyze.
🎓 Learn: Weekly posts explaining key financial concepts.
Don’t forget to subscribe to my channel and stay tuned for the next analyses! 🫡
👉 For more insights from me, follow me on:
X: @LeFinanceDude
Instagram: @LeFinanceDude
YouTube: youtube.com/@lefinancedude
TikTok: @LeFinanceDude