
Build Your Own Broadcom Valuation Model: DCF Tool Inside
Test your thesis: A downloadable DCF model for Broadcom valuation.

Hey Friend,
I just published my Broadcom Analysis 1.0 — if you haven’t read it yet, check it out here:

In it, I run Broadcom’s business through a DCF model with three scenarios — base, bull, and bear — built on Wall Street analysts’ consensus estimates. Average estimates for the base case, highest for the bull, lowest for the bear. It’s a quick valuation gauge, not a deep conviction model.
Here’s why.
The Analysis 1.0 is a filter. Twenty metrics. Five dimensions (Growth, Profitability, Solvency, Valuation, and Shareholders’ Return). The goal is to answer one question: does this business deserve a deeper look? It’s fast, data-driven, and designed to separate the businesses worth studying from the ones that aren’t. The DCF inside it reflects the market’s own expectations — useful as a reference point, but not something I’d bet my money on alone.
The Analysis 2.0 is where the real work happens. That’s where I stress-test every assumption — the business model, the moat, the management, the risks, the capital allocation track record — and build a valuation from the ground up based on my own view of the business. That’s the conviction builder. The answer to the only question that actually matters: should I buy this stock?
But here’s the thing.
Between the high-level consensus DCF in the Analysis 1.0 and my own stress-tested model in the Analysis 2.0 — there’s a version that’s yours to build.
That’s what this file is for.
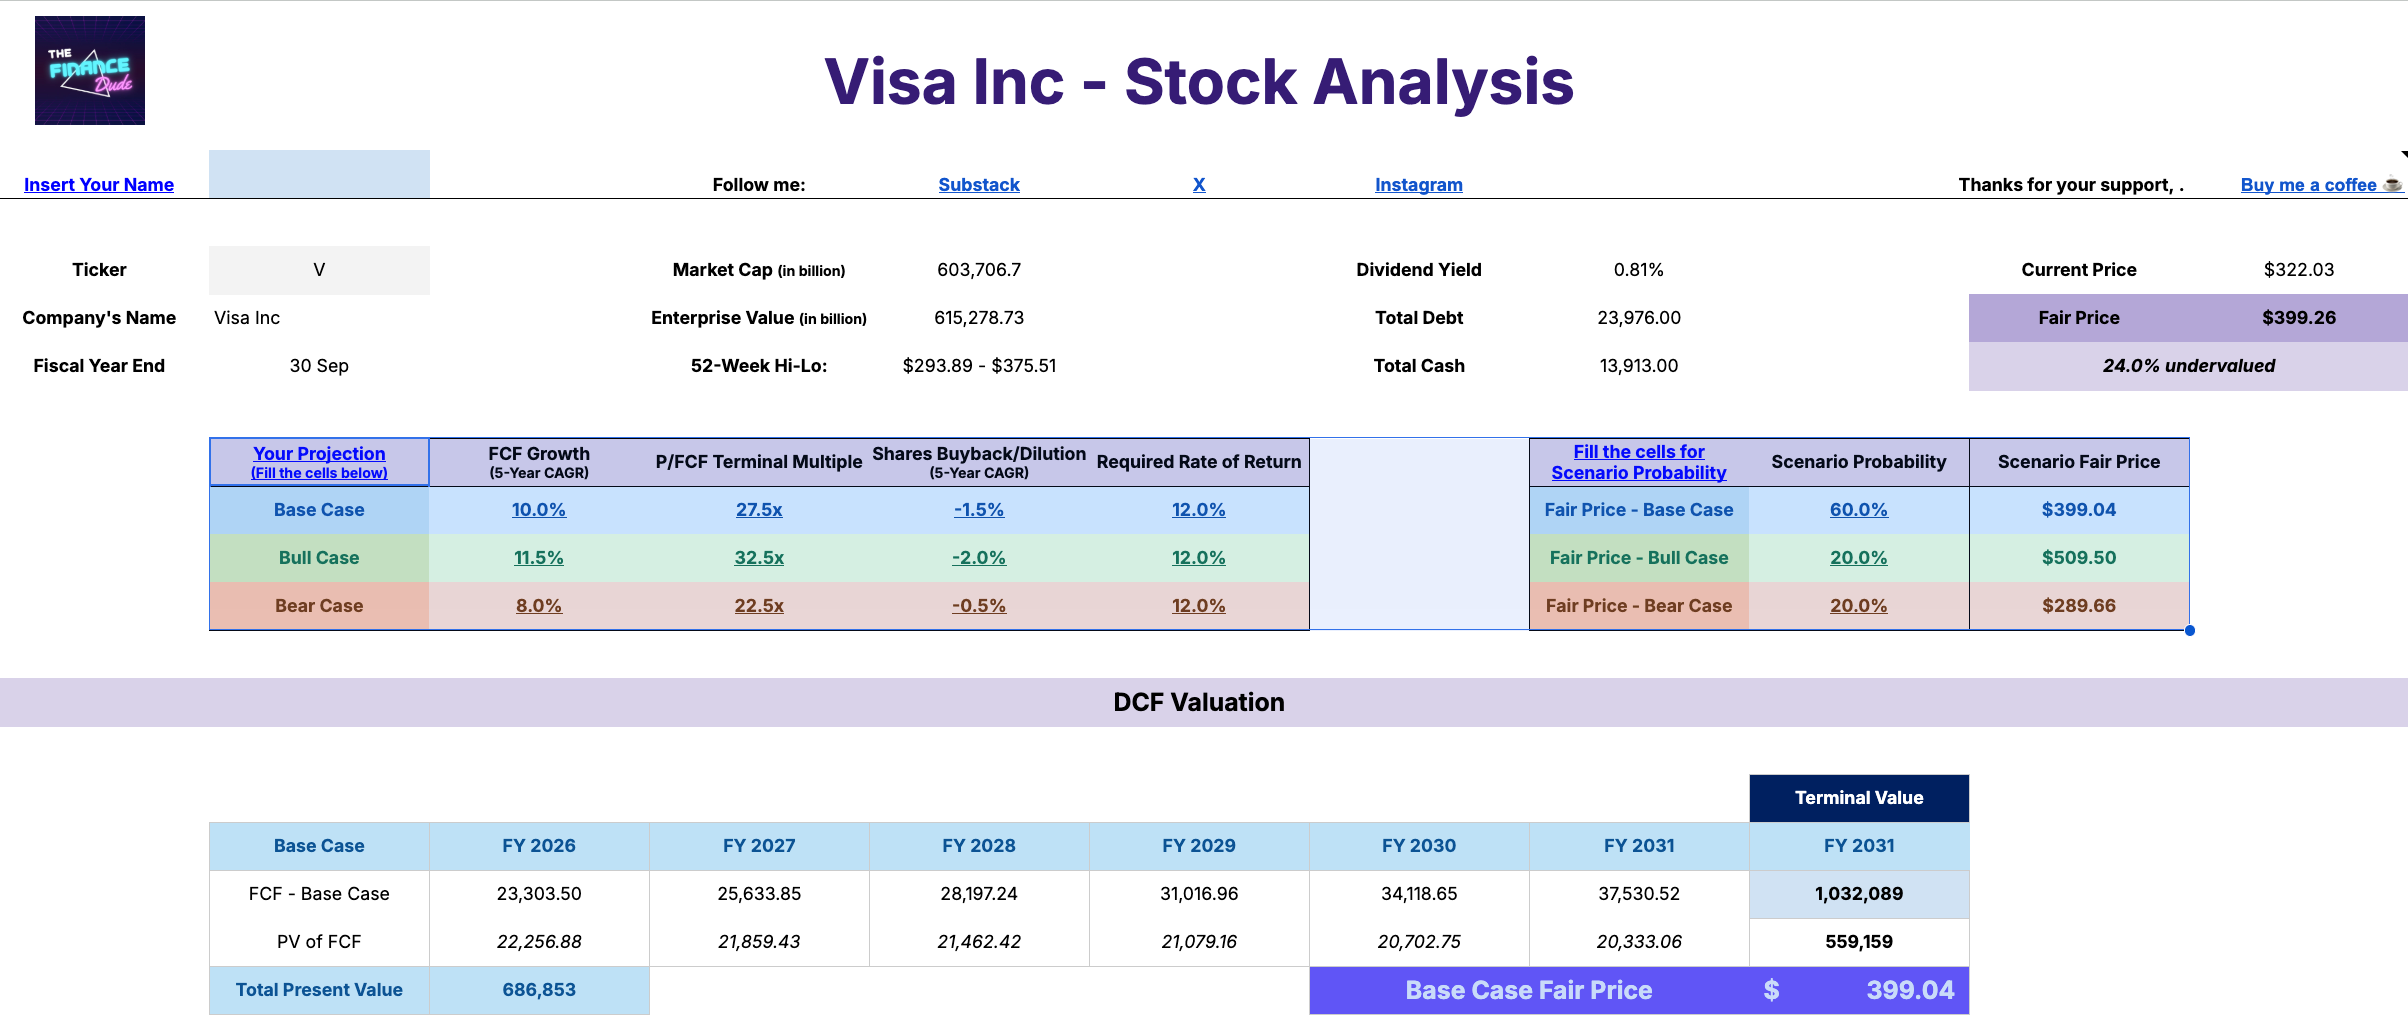
I built a DCF spreadsheet preloaded with Broadcom’s data so you can plug in your own assumptions and get your own fair value estimate. You control:
FCF Growth — what growth rate do you believe in?
Terminal Multiple (P/FCF) — what multiple does Broadcom deserve at maturity, in your view?
Shares Outstanding — do you think buybacks continue at the same pace?
Hurdle Rate — what’s your personal required rate of return?
Scenario Probabilities — how much weight do you put on the base, bull, and bear case?
The output updates instantly. Your price target. Your implied upside or downside. Your scenarios, side by side.
Not what analysts say. Not what the market implies. What you think — built on your own assumptions.
📥 What’s Inside
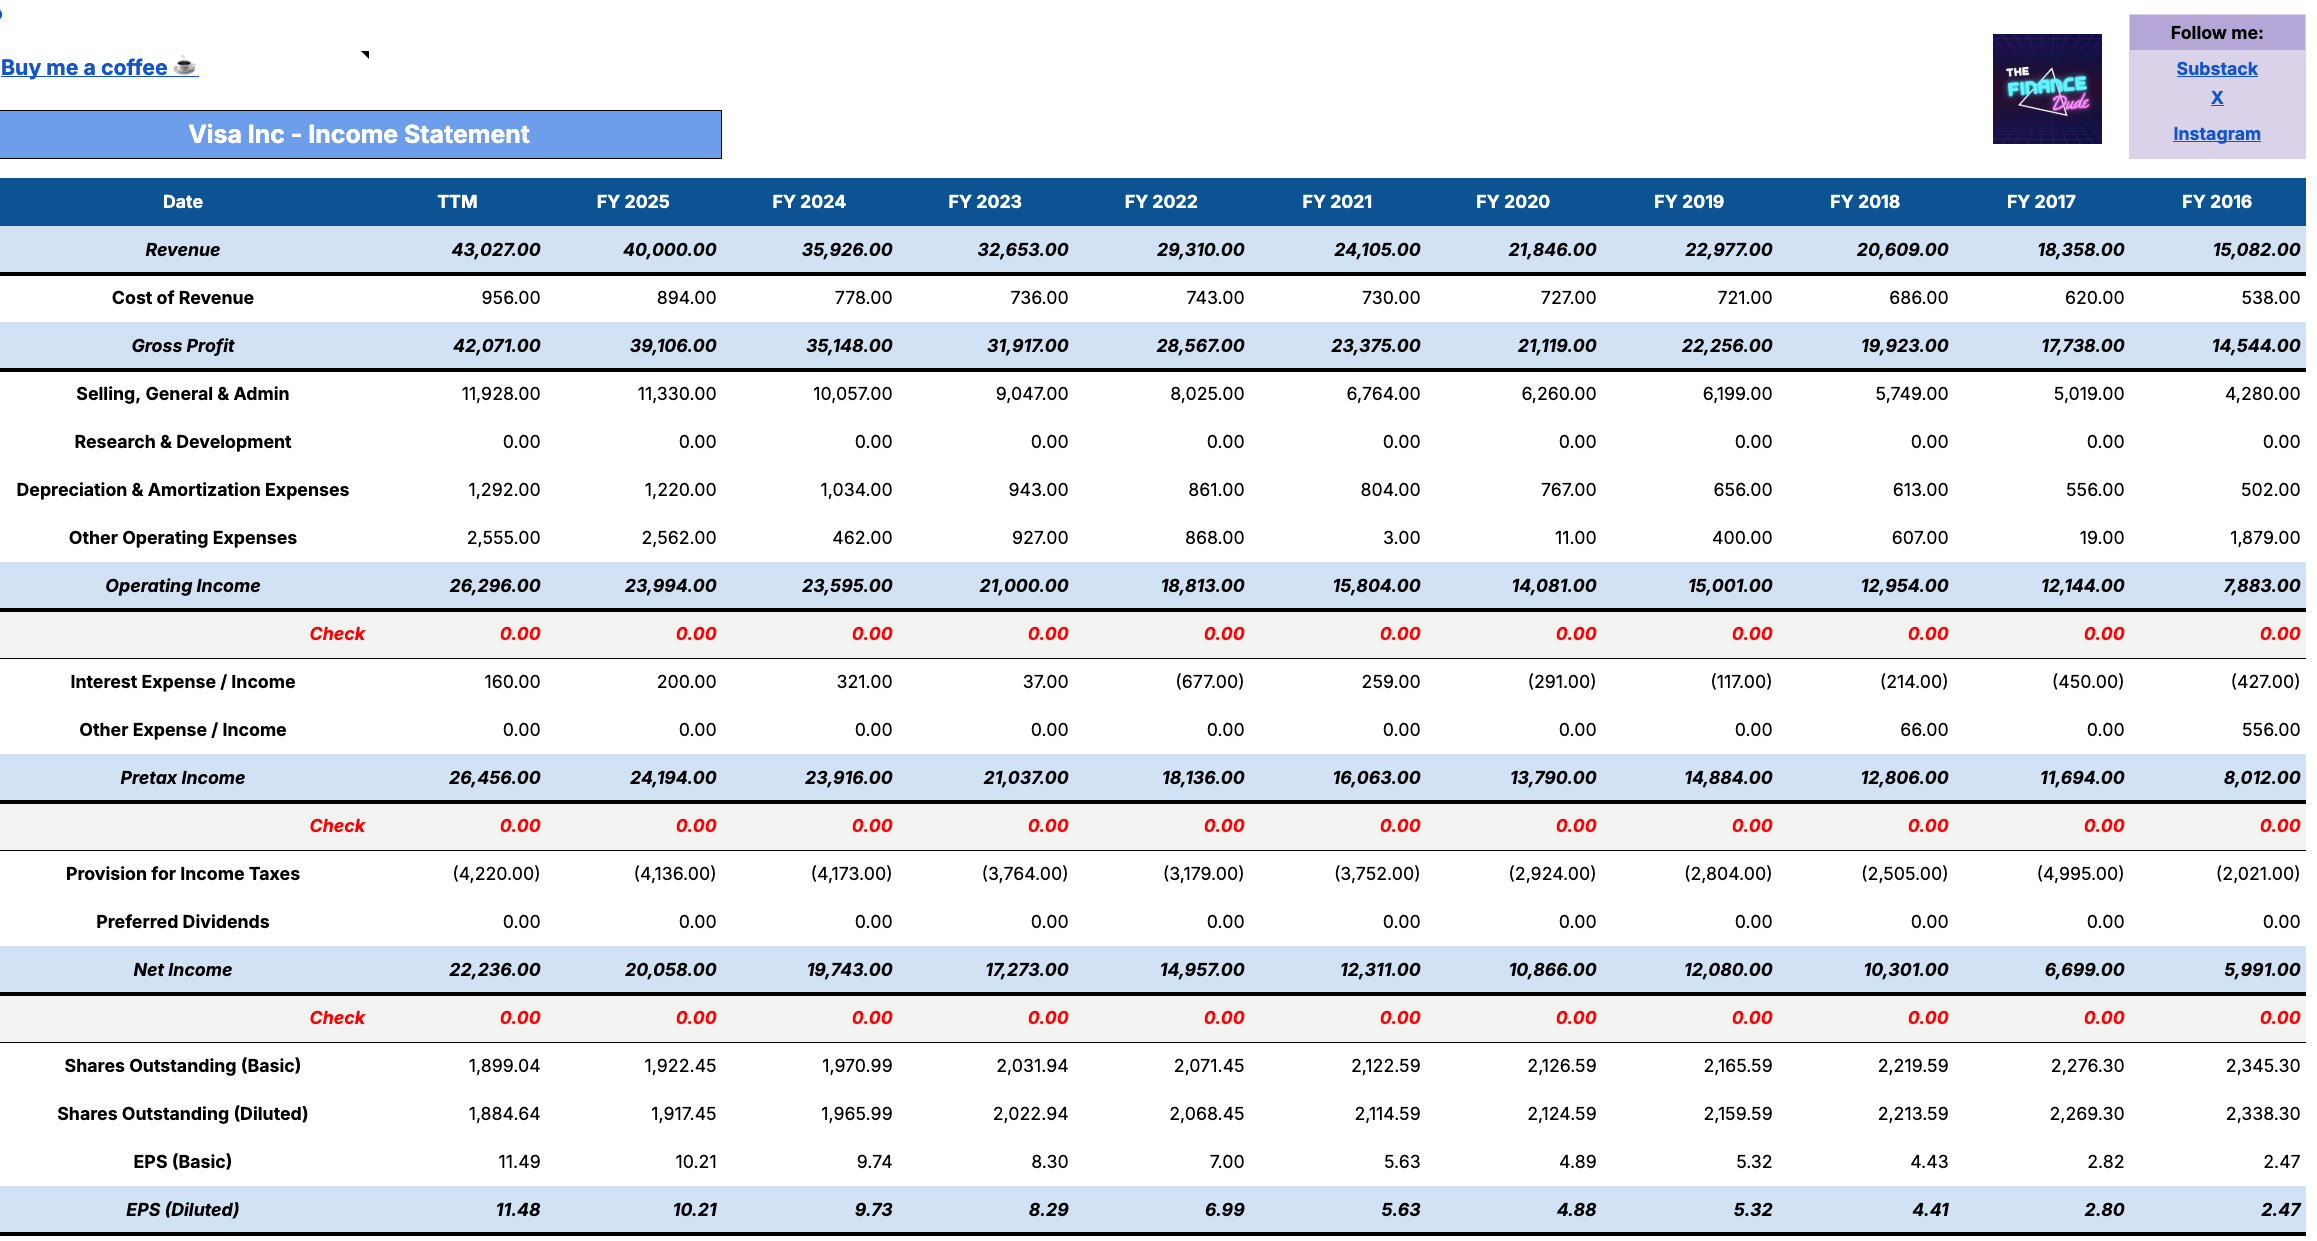
✅ A clean, editable DCF — preloaded with Broadcom’s data
Ten years of financial history already loaded in.
✅ Your four key inputs — your assumptions, your output
FCF Growth Rate
Terminal Multiple (P/FCF)
Annual Change in Shares Outstanding
Your personal hurdle rate (discount rate)
Adjust the scenario probabilities to reflect how much weight you put on base, bull, and bear. The price target and implied upside update automatically.
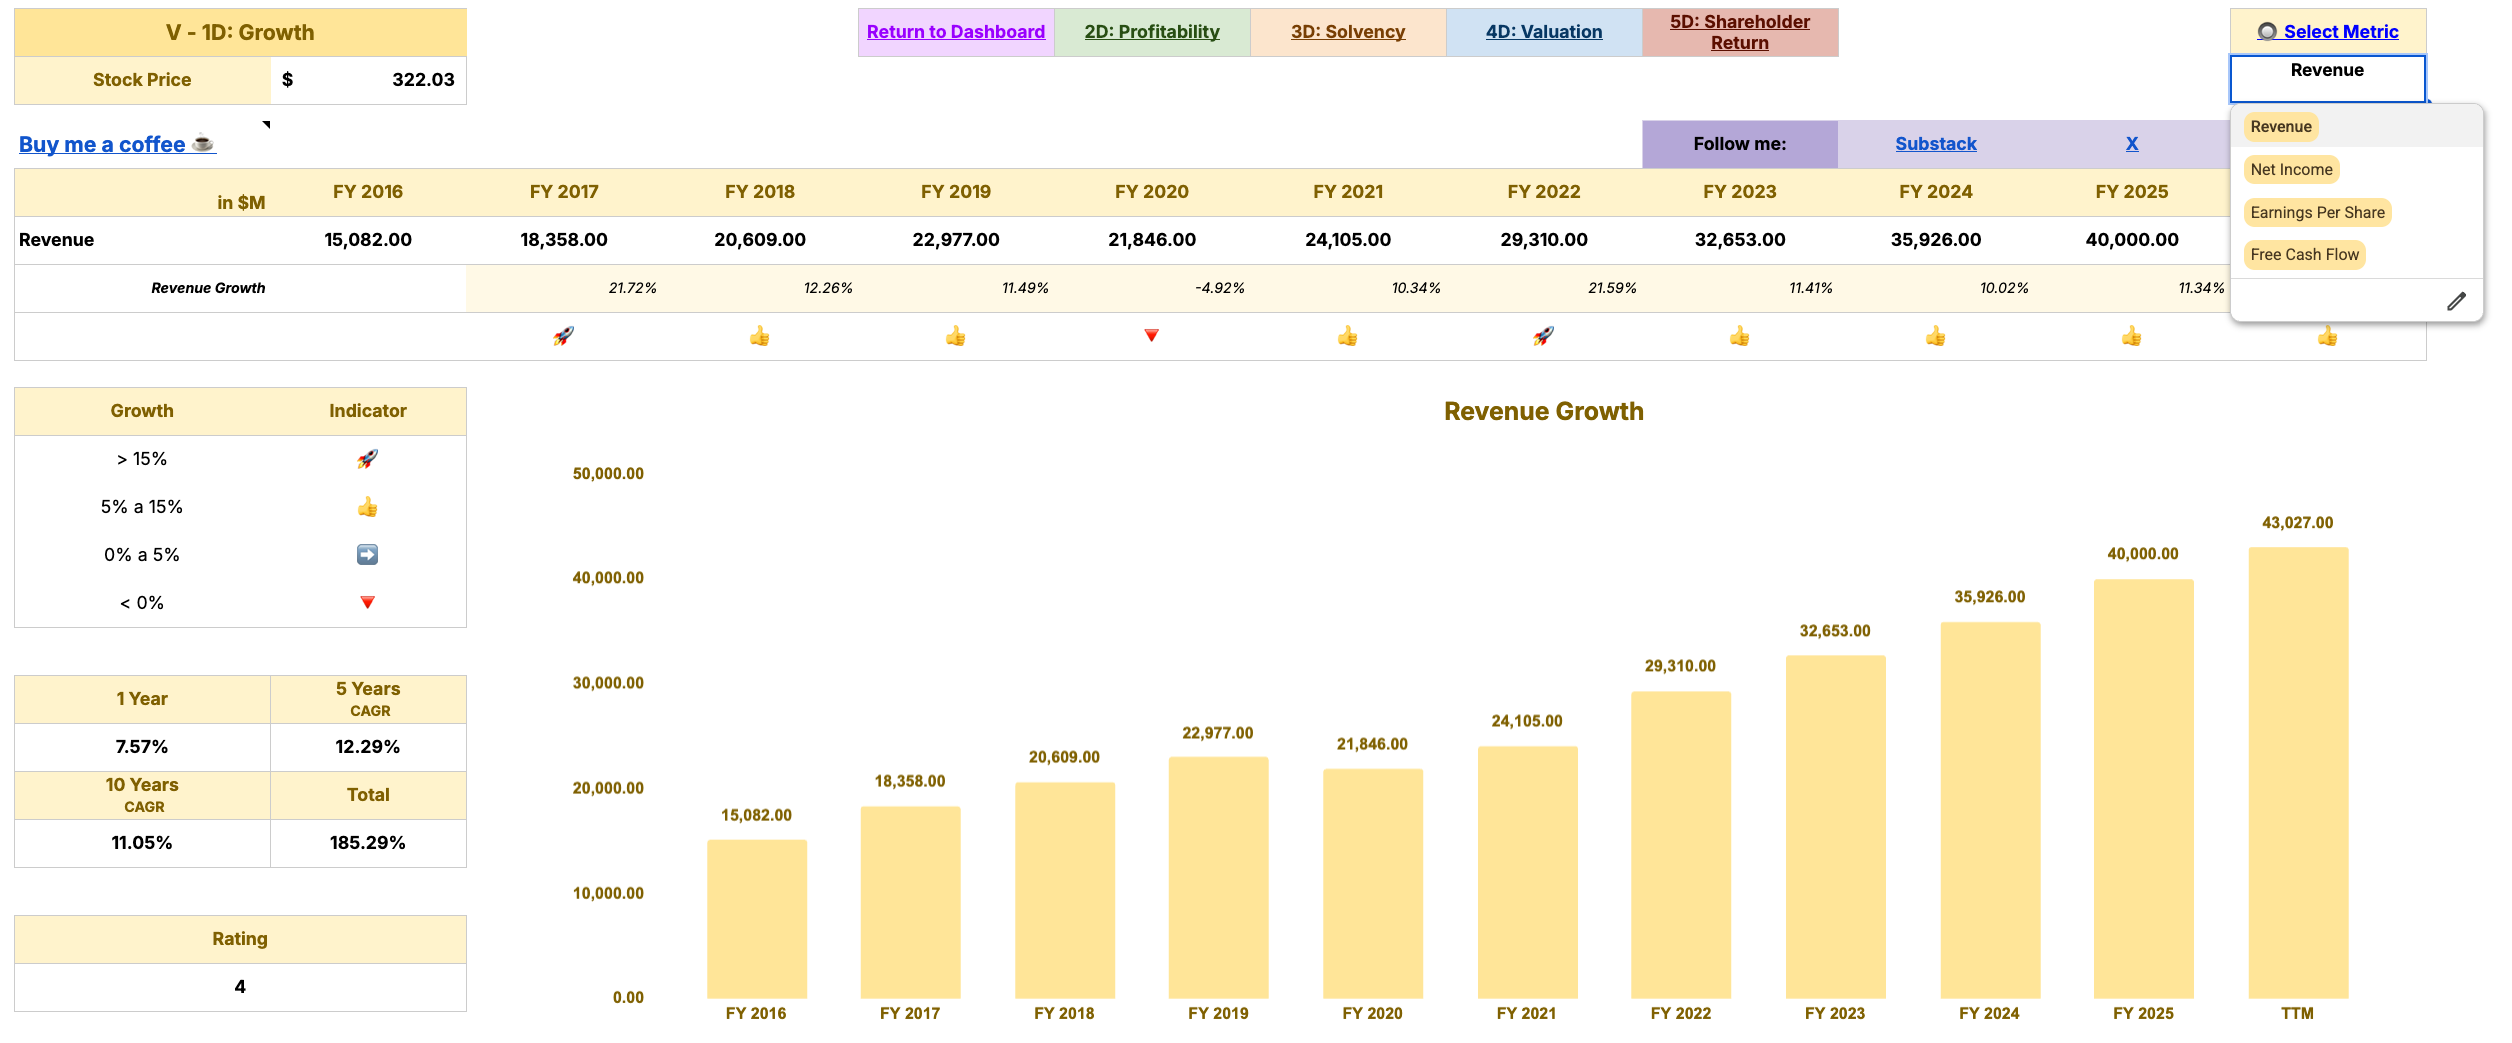
✅ The Five Dimensions framework, built in
Every metric from the Analysis 1.0 — tracked across 10 years, with automatic charts per dimension: Growth, Profitability, Solvency, Valuation, and Shareholder Return. This is the same system behind every rating in the post you just read.
✅ All data sourced from StockAnalysis.com
Every number in this file — income statement, balance sheet, cash flow, valuation multiples — was pulled from StockAnalysis.com. It’s the cleanest financial database I’ve ever found, and the one I use for every analysis I publish.Use the code THEFINANCEDUDE10 for 10% discount:
Why this matters
Most investors read an analysis and take the verdict at face value. The ones who actually build wealth over time don’t do that — they stress-test the assumptions, understand where the uncertainty lives, and form their own view.
This file is how you do that.
Your turn
Once you’ve run your own numbers — drop your fair value estimate in the comments. I want to see where people land.
What’s your base case price target for Broadcom?
This tool is available exclusively for paid subscribers. Every stock I analyze gets its own file — same model, preloaded with fresh data, ready to stress-test.
If you’re on the free tier and want access to every valuation file I build, the paid subscription is where they live.
