
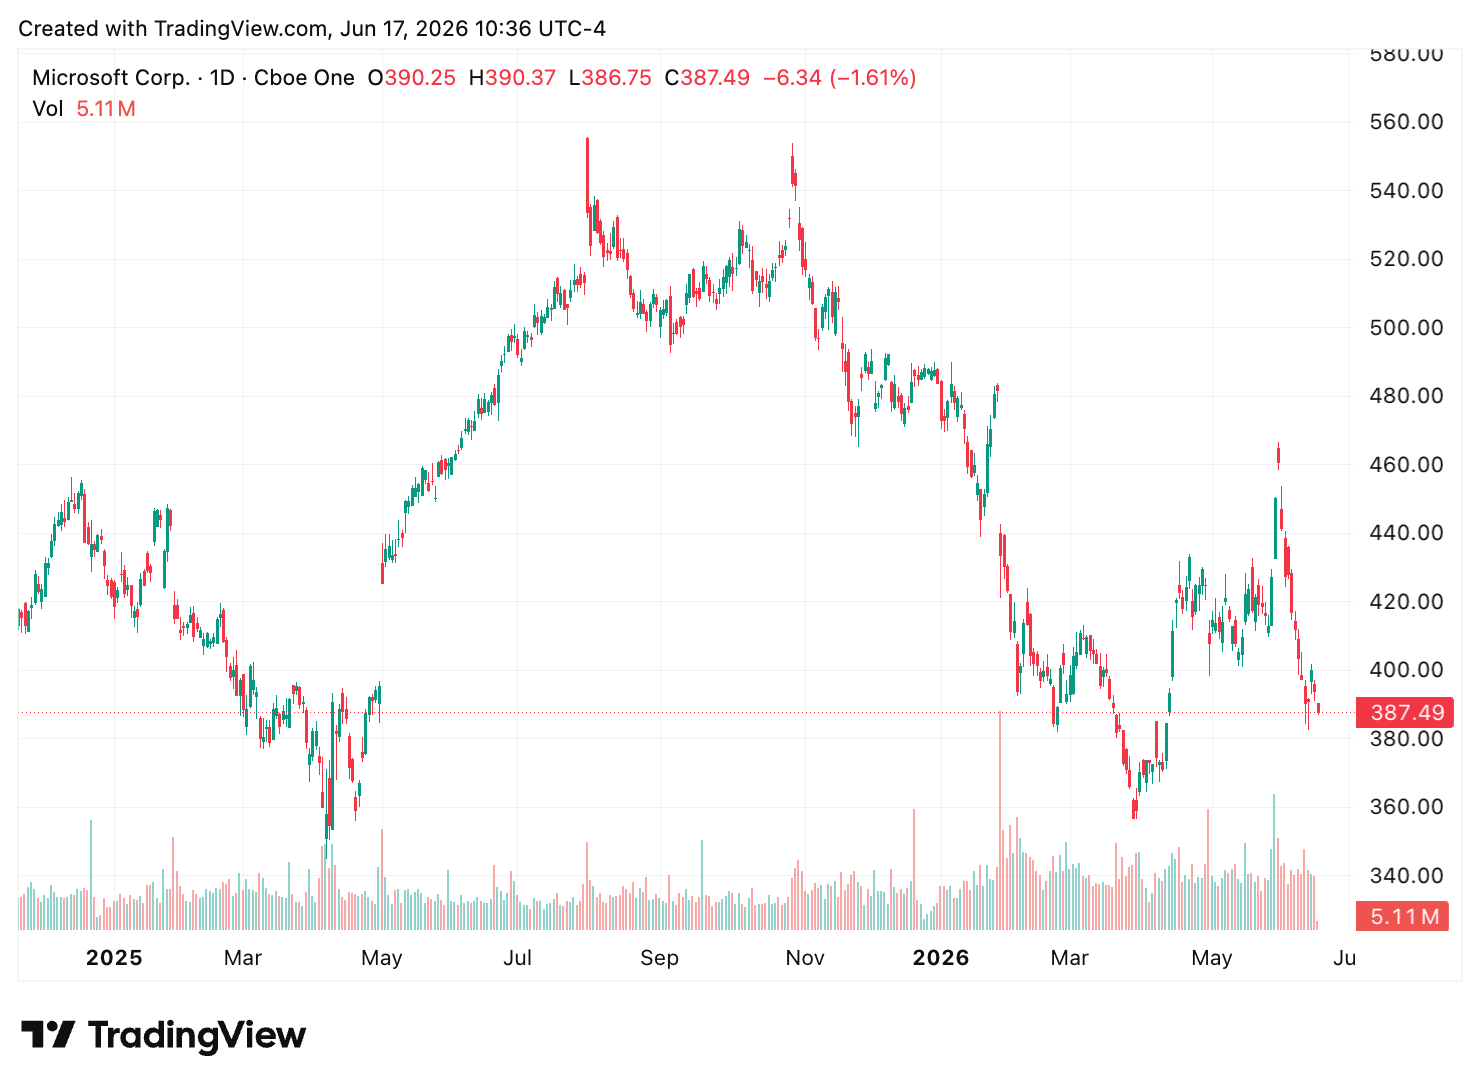
$MSFT Deep Dive | Microsoft Is Down 30% — and Cheaper Than It's Been in Years
The best quarter in its history, a $627B backlog, and a $190B bet that splits the whole thesis in two.

Hi Dude ✌️
Microsoft just had the best revenue quarter in its 51-year history.
Revenue hit $82.9 billion
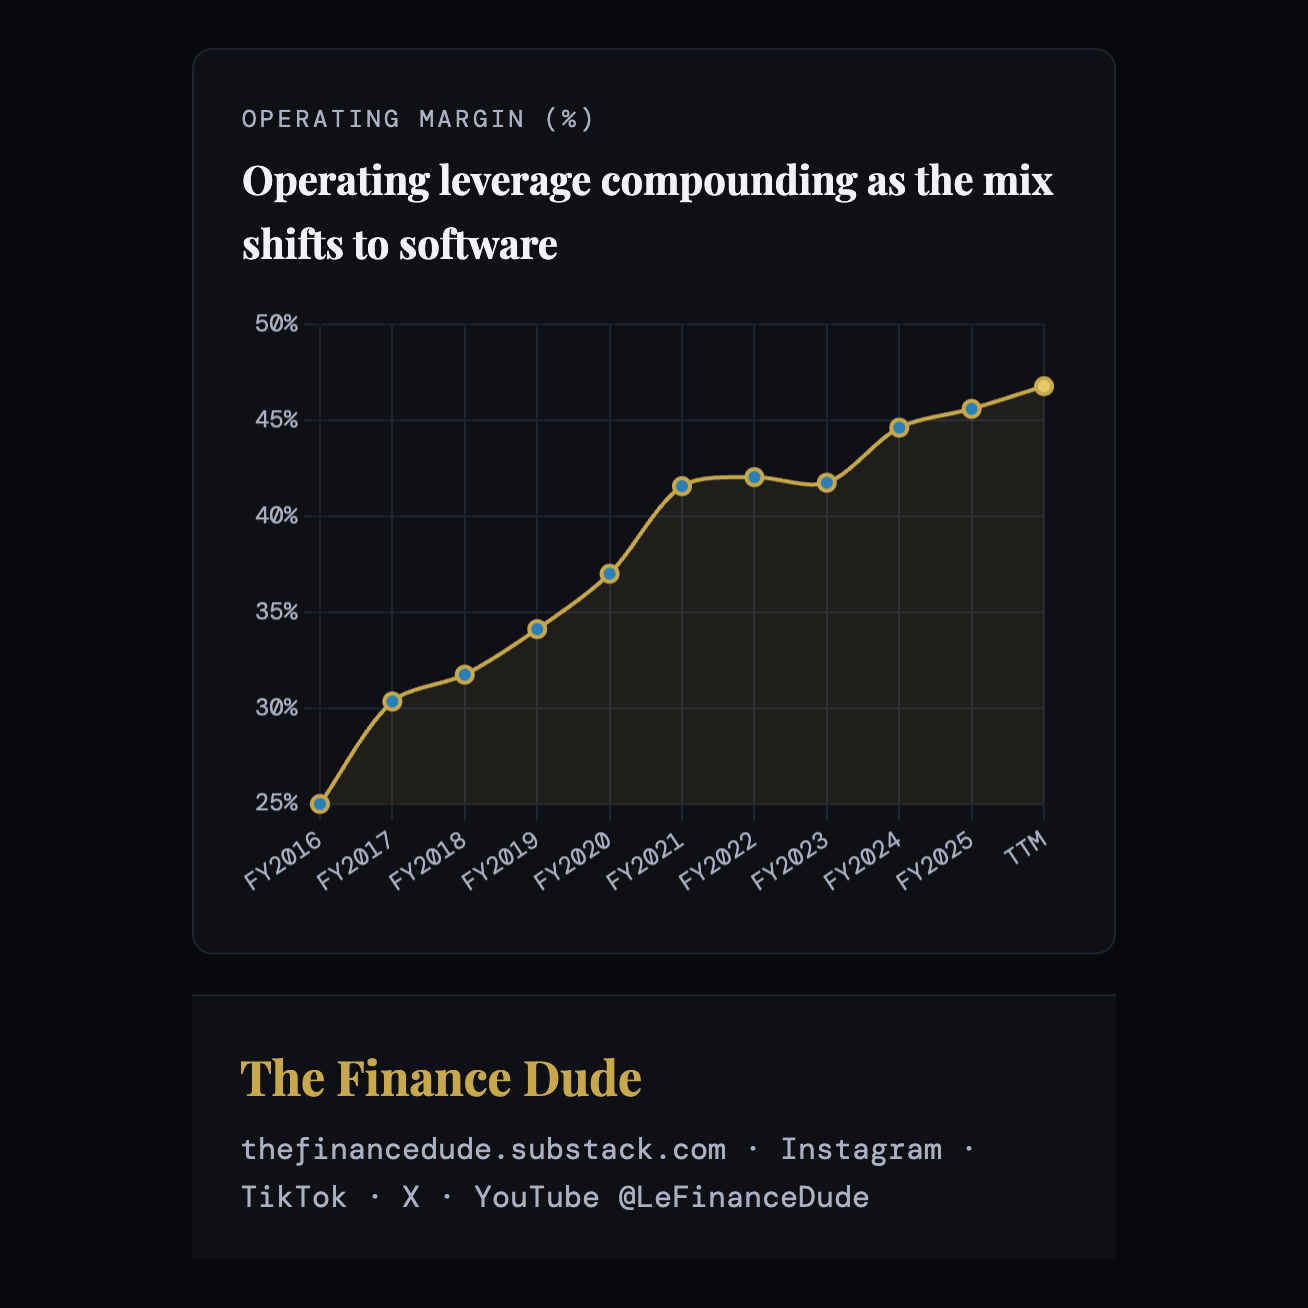
Operating margin came in at 47%
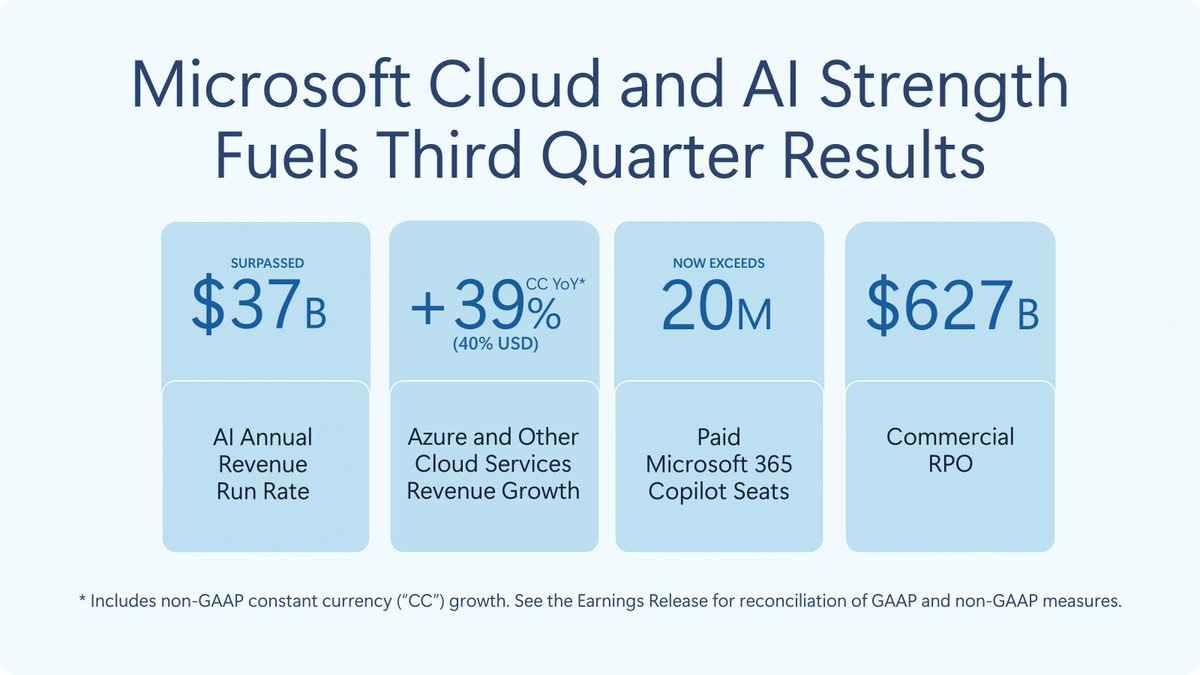
The AI business is now running at a $37 billion annual pace, growing 123% a year
Backlog (RPO) sits at $627 billion — nearly double a year ago
And the stock is down 30% from its high.
Here’s what makes this a real debate. Microsoft’s free cash flow has barely moved in three years — about $73 billion over the last twelve months, versus $74 billion two years ago. That sounds fine until you notice revenue grew nearly a third over the same span. Cash flow stood still while the business expanded by a third, because capital spending is swallowing the growth. And it is about to swallow far more: Microsoft plans to spend roughly $190 billion on data centers and chips in calendar 2026 alone.
So the whole stock comes down to one question. Is that $190 billion the greatest land-grab in the history of enterprise computing — locking in the agentic era the way Windows locked in the PC — or is it the sound of a bubble inflating, capex chasing demand that won’t show up?
$627 billion of backlog says the demand is real. $190 billion of annual spend says the bill is enormous. At $390.74, is this expensive or cheap?
Let’s dive in.
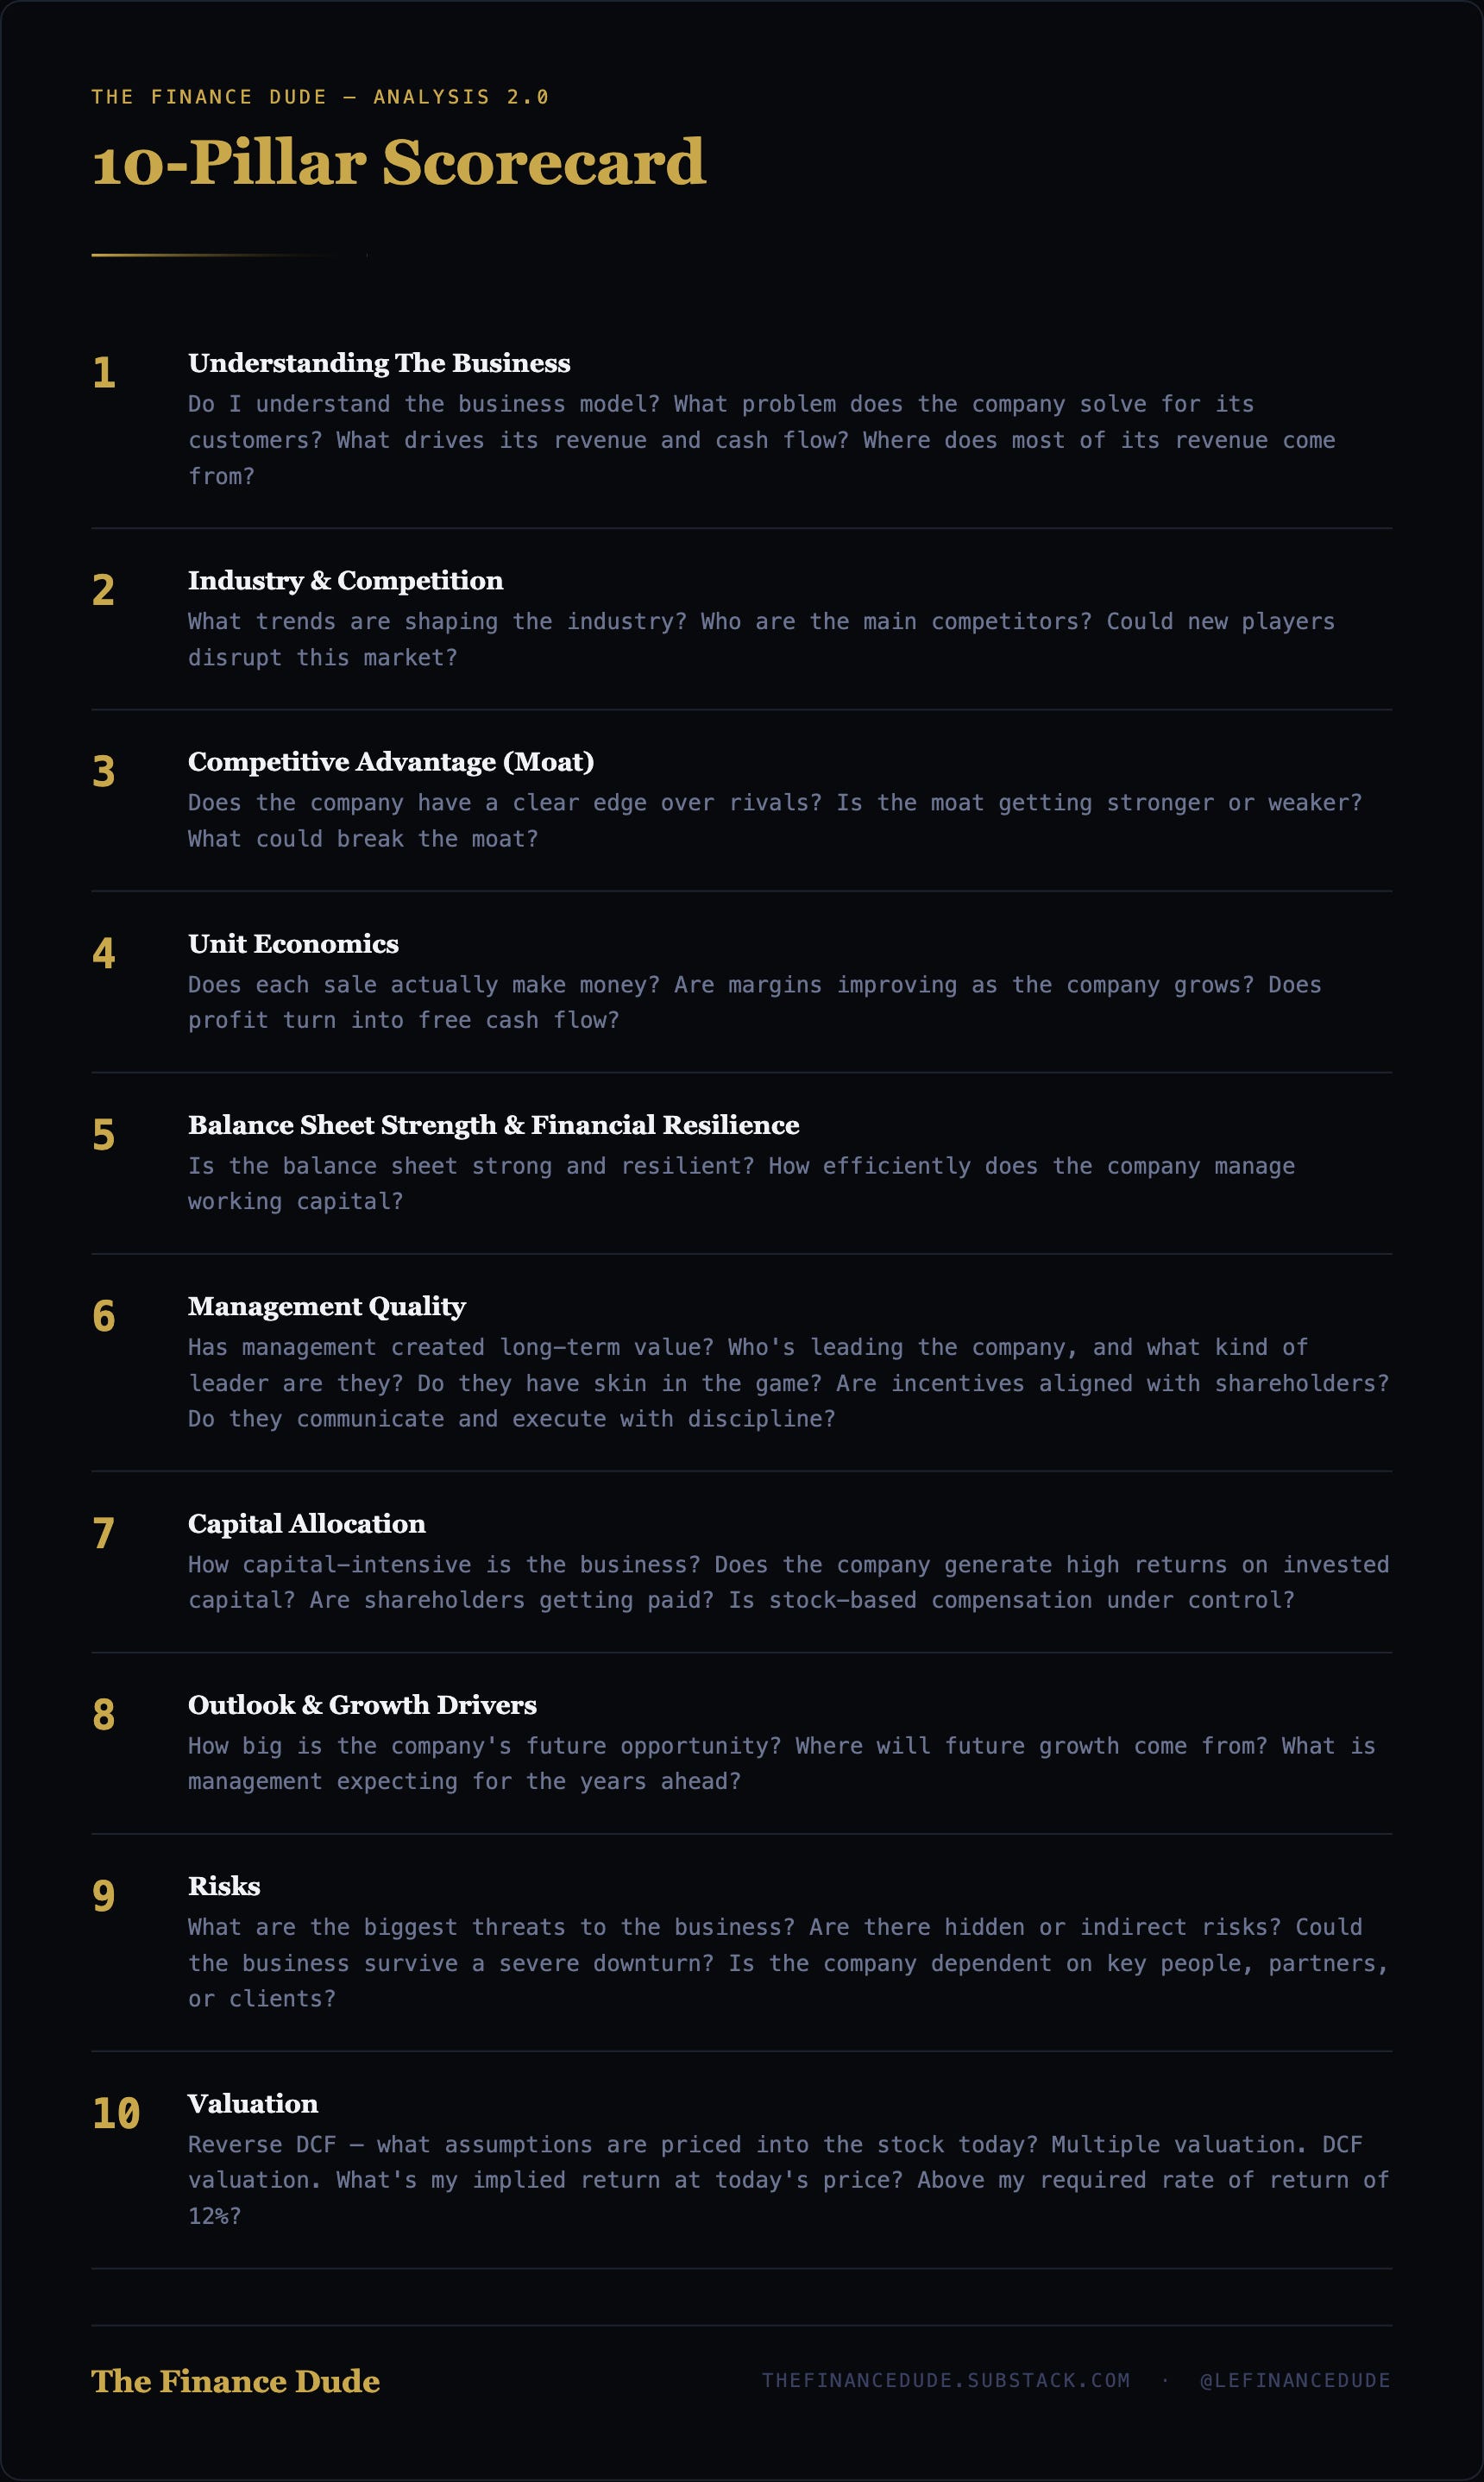
10-Pillar Checklist
The 10-Pillar Checklist is how top investors break down any company — clear, structured, and focused on what really drives value. It covers everything from moat to management to valuation, giving you a full picture of business quality in minutes. And that’s why reading my analyses puts you ahead of the pack.
At the end of this article, I’ll give a score on each of these 10 Pillars.
Pillar 1. Understanding The Business
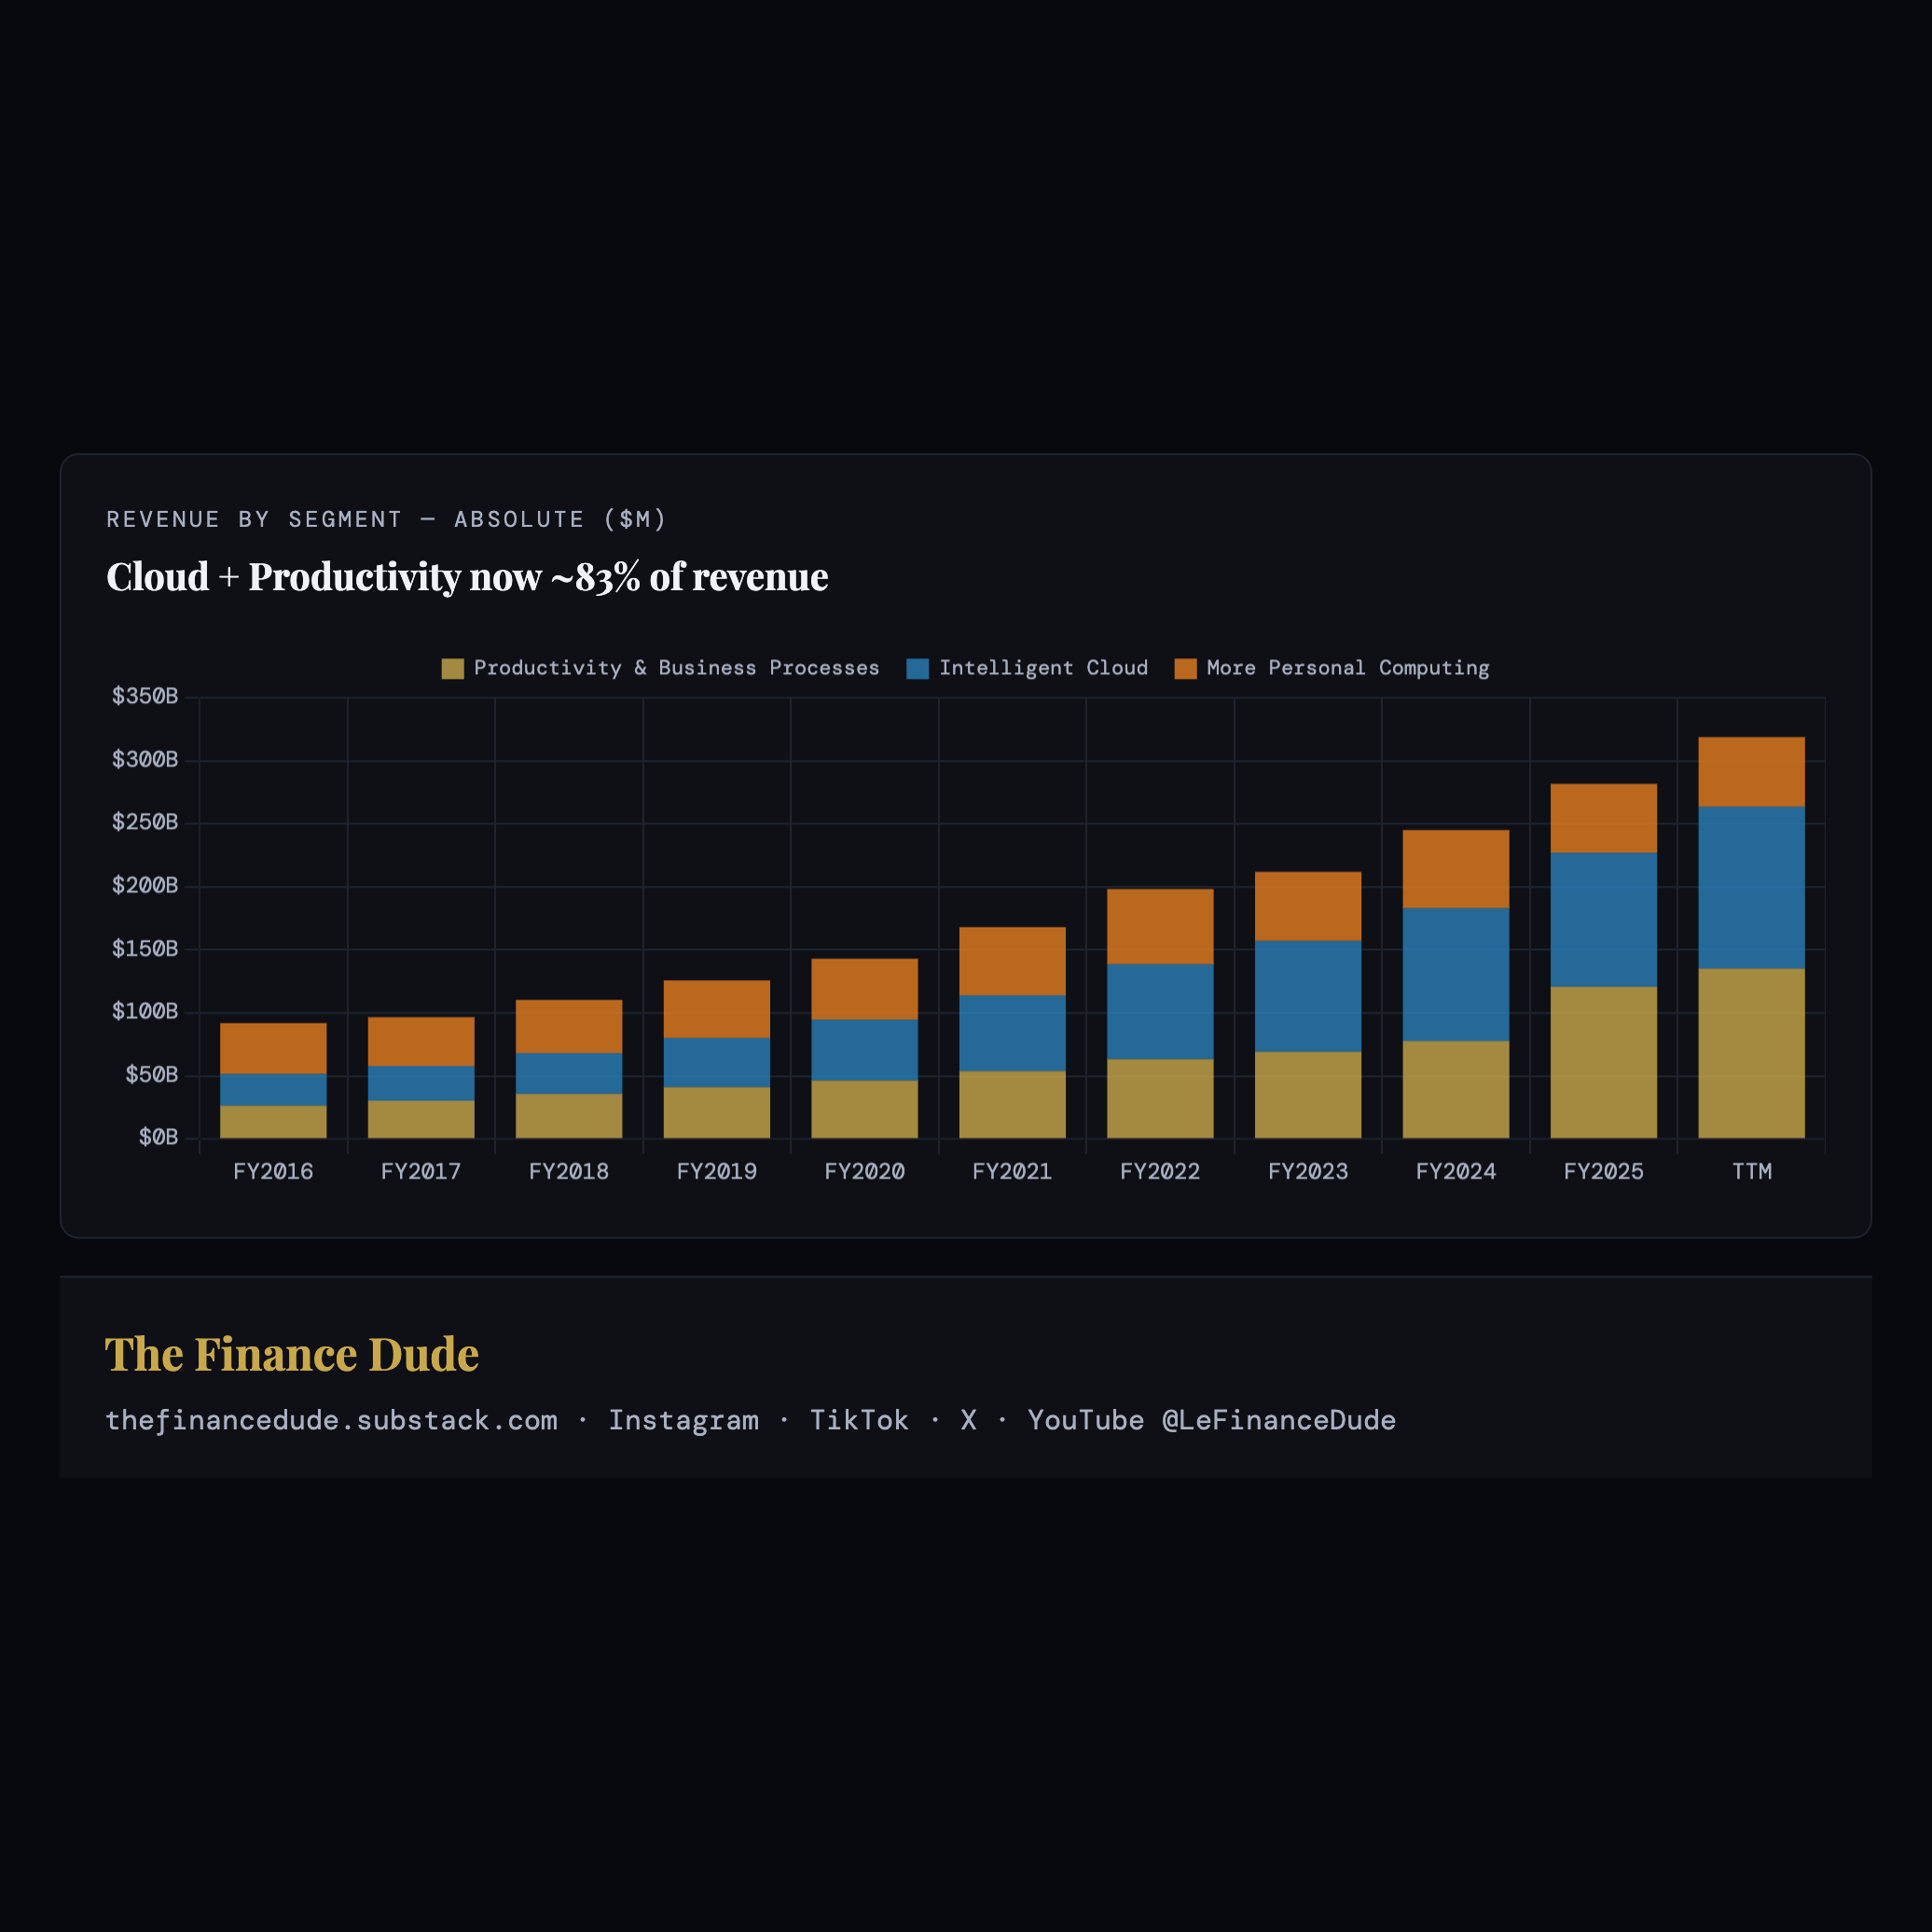
Microsoft operates through three reportable segments, and the fastest way to understand the company is to know what sits in each:
Productivity & Business Processes — $135.3B TTM in revenue, ~59.9% operating margin. The Microsoft 365 suite (formerly Office 365) for commercial and consumer customers, LinkedIn, and Dynamics 365 (ERP and CRM). Now the company’s single largest profit contributor.
Intelligent Cloud — $128.4B TTM in revenue, ~41.4% operating margin. Anchored by Azure, Microsoft’s hyperscale cloud and platform-as-a-service business, alongside SQL Server, Windows Server, and enterprise support. This is the fastest-growing segment — Q3 FY2026 revenue hit $34.7B, up 30% year-over-year.
More Personal Computing — $55.2B TTM, ~26.9% operating margin. Windows OEM (~72% of the world's PCs) and commercial licensing, Xbox hardware and content, Surface devices, and search/news advertising through Bing. The slower-growth legacy base.
One figure cuts across these segments rather than sitting inside any single one: Microsoft’s AI annual revenue run rate — the current pace of AI-related revenue, annualized — has surpassed $37 billion, up 123% year-over-year. It is not a reported segment but a cross-cutting disclosure, combining Azure AI consumption (Azure OpenAI and AI infrastructure, reported in Intelligent Cloud) with Microsoft 365 Copilot — the AI assistant priced at $30 per user per month, now exceeding 20 million paid enterprise seats and reported in Productivity & Business Processes — alongside GitHub Copilot (the market-leading AI coding assistant, with well over 1.8 million paying developers) and Security Copilot. Microsoft reports it separately precisely because AI monetization spans the whole business, and at that growth rate it is still in early innings.
In fiscal 2025 (ended June 30, 2025), Microsoft reported total revenue of roughly $281.7 billion, up about 16% year-over-year — growth that has been consistent and, recently, accelerating, driven primarily by Azure’s 33–40% annual expansion and the deepening monetization of AI through the Copilot family. By Q3 FY2026 (ended March 31, 2026), quarterly revenue reached $82.9 billion, up 18.3%.
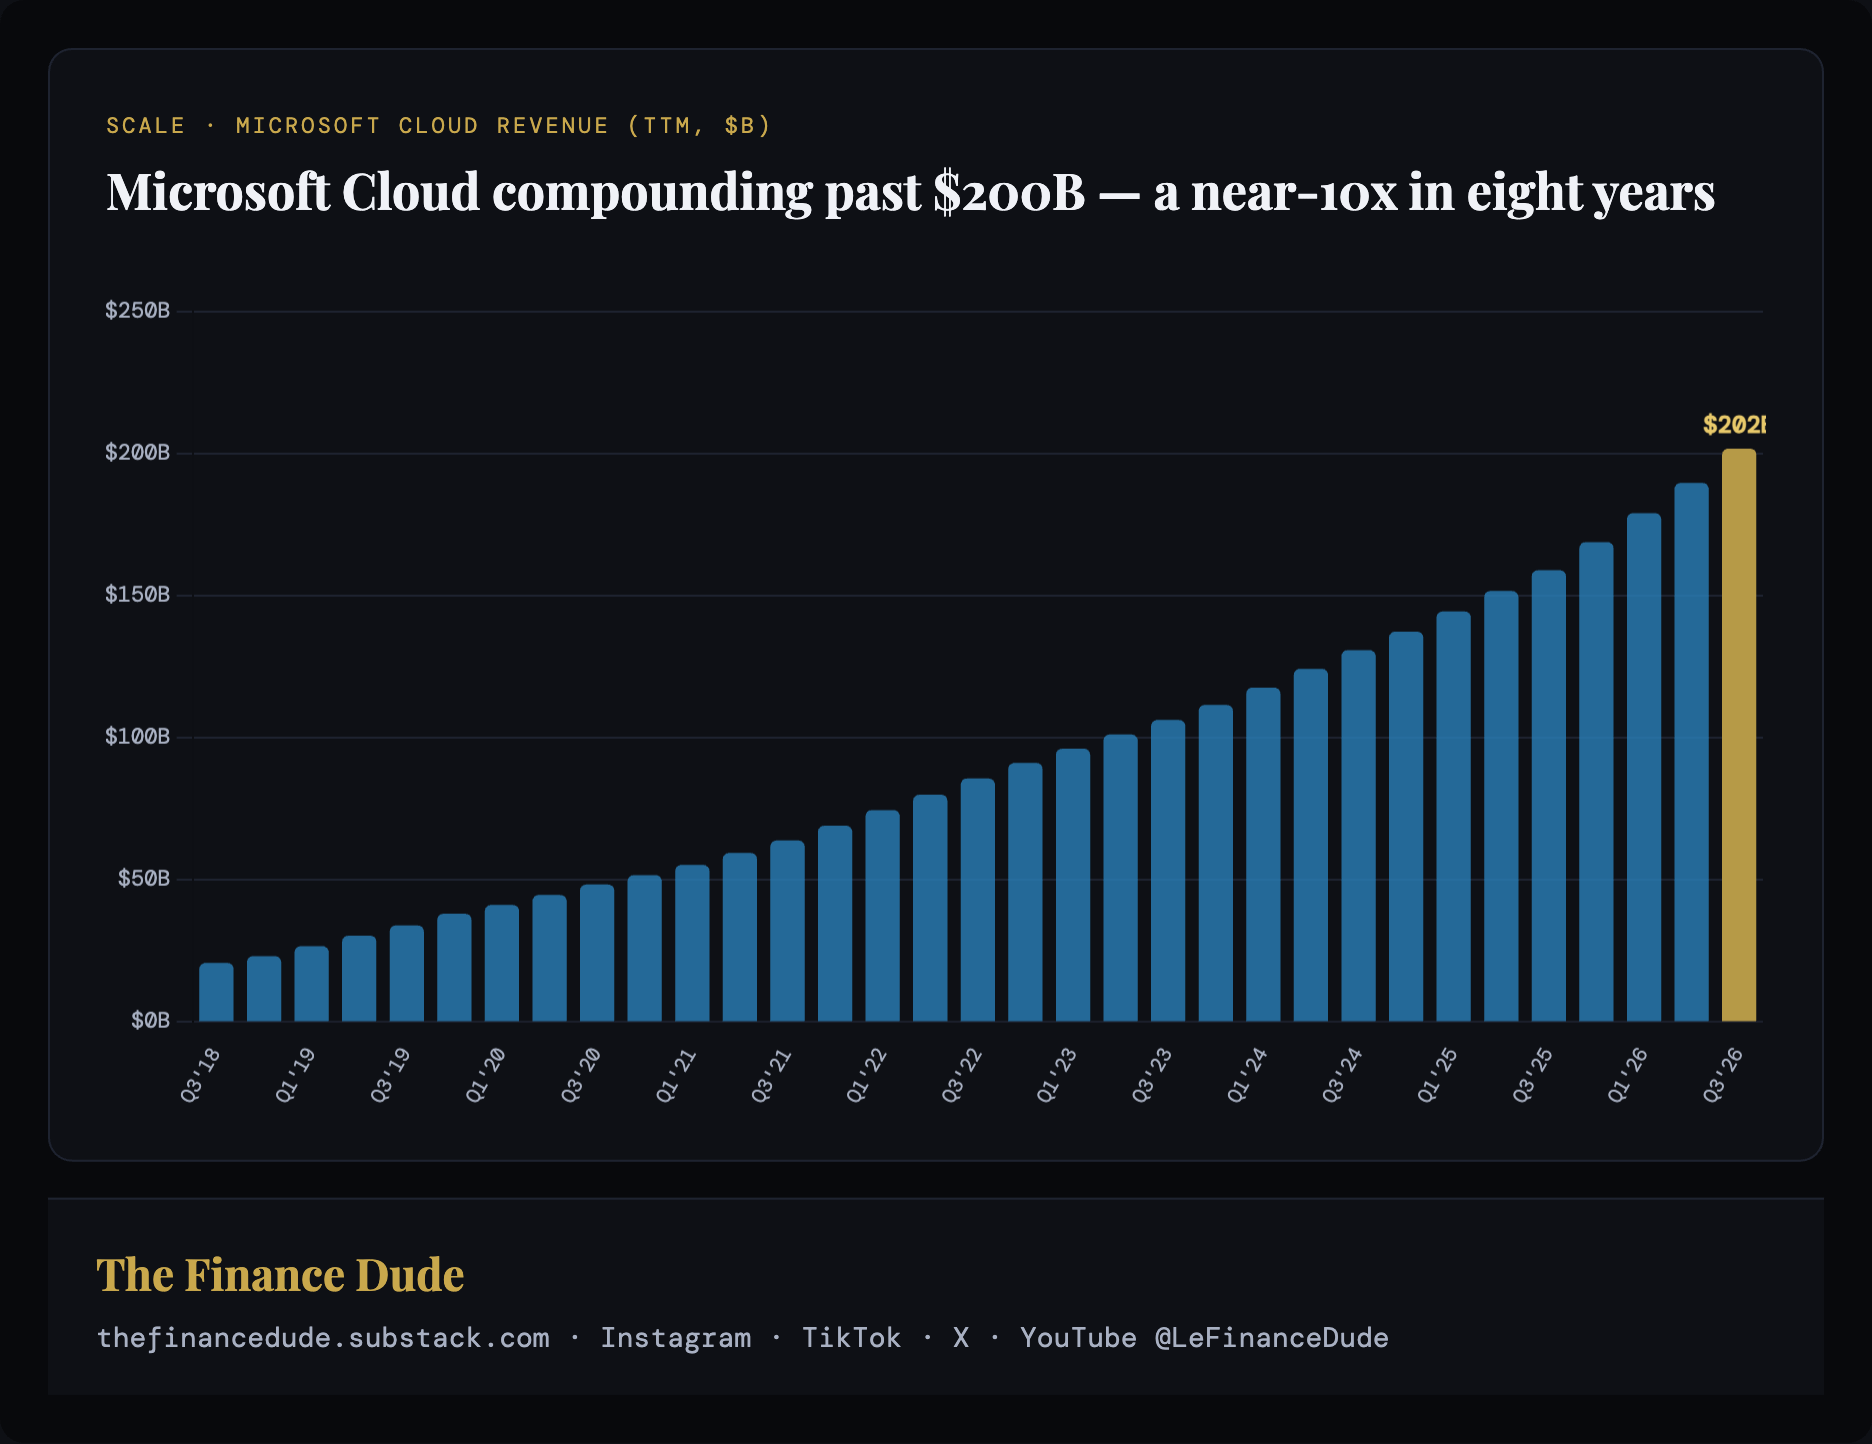
Like the AI run rate, Microsoft's cloud business is reported across segments rather than as a single line. The company discloses a cross-segment metric it calls "Microsoft Cloud" (or Commercial Cloud) that adds up its commercial cloud revenue wherever it sits: Azure (in Intelligent Cloud), plus Microsoft 365 Commercial cloud, Dynamics 365, and LinkedIn's commercial services (in Productivity & Business Processes). It is deliberately not the same as the Intelligent Cloud segment — that segment also carries on-premises server licenses and leaves out the Microsoft 365 and LinkedIn cloud — so Microsoft Cloud is the truer measure of the total cloud franchise. On a trailing-twelve-month basis it has now compounded past $200 billion, close to a 10x in eight years.
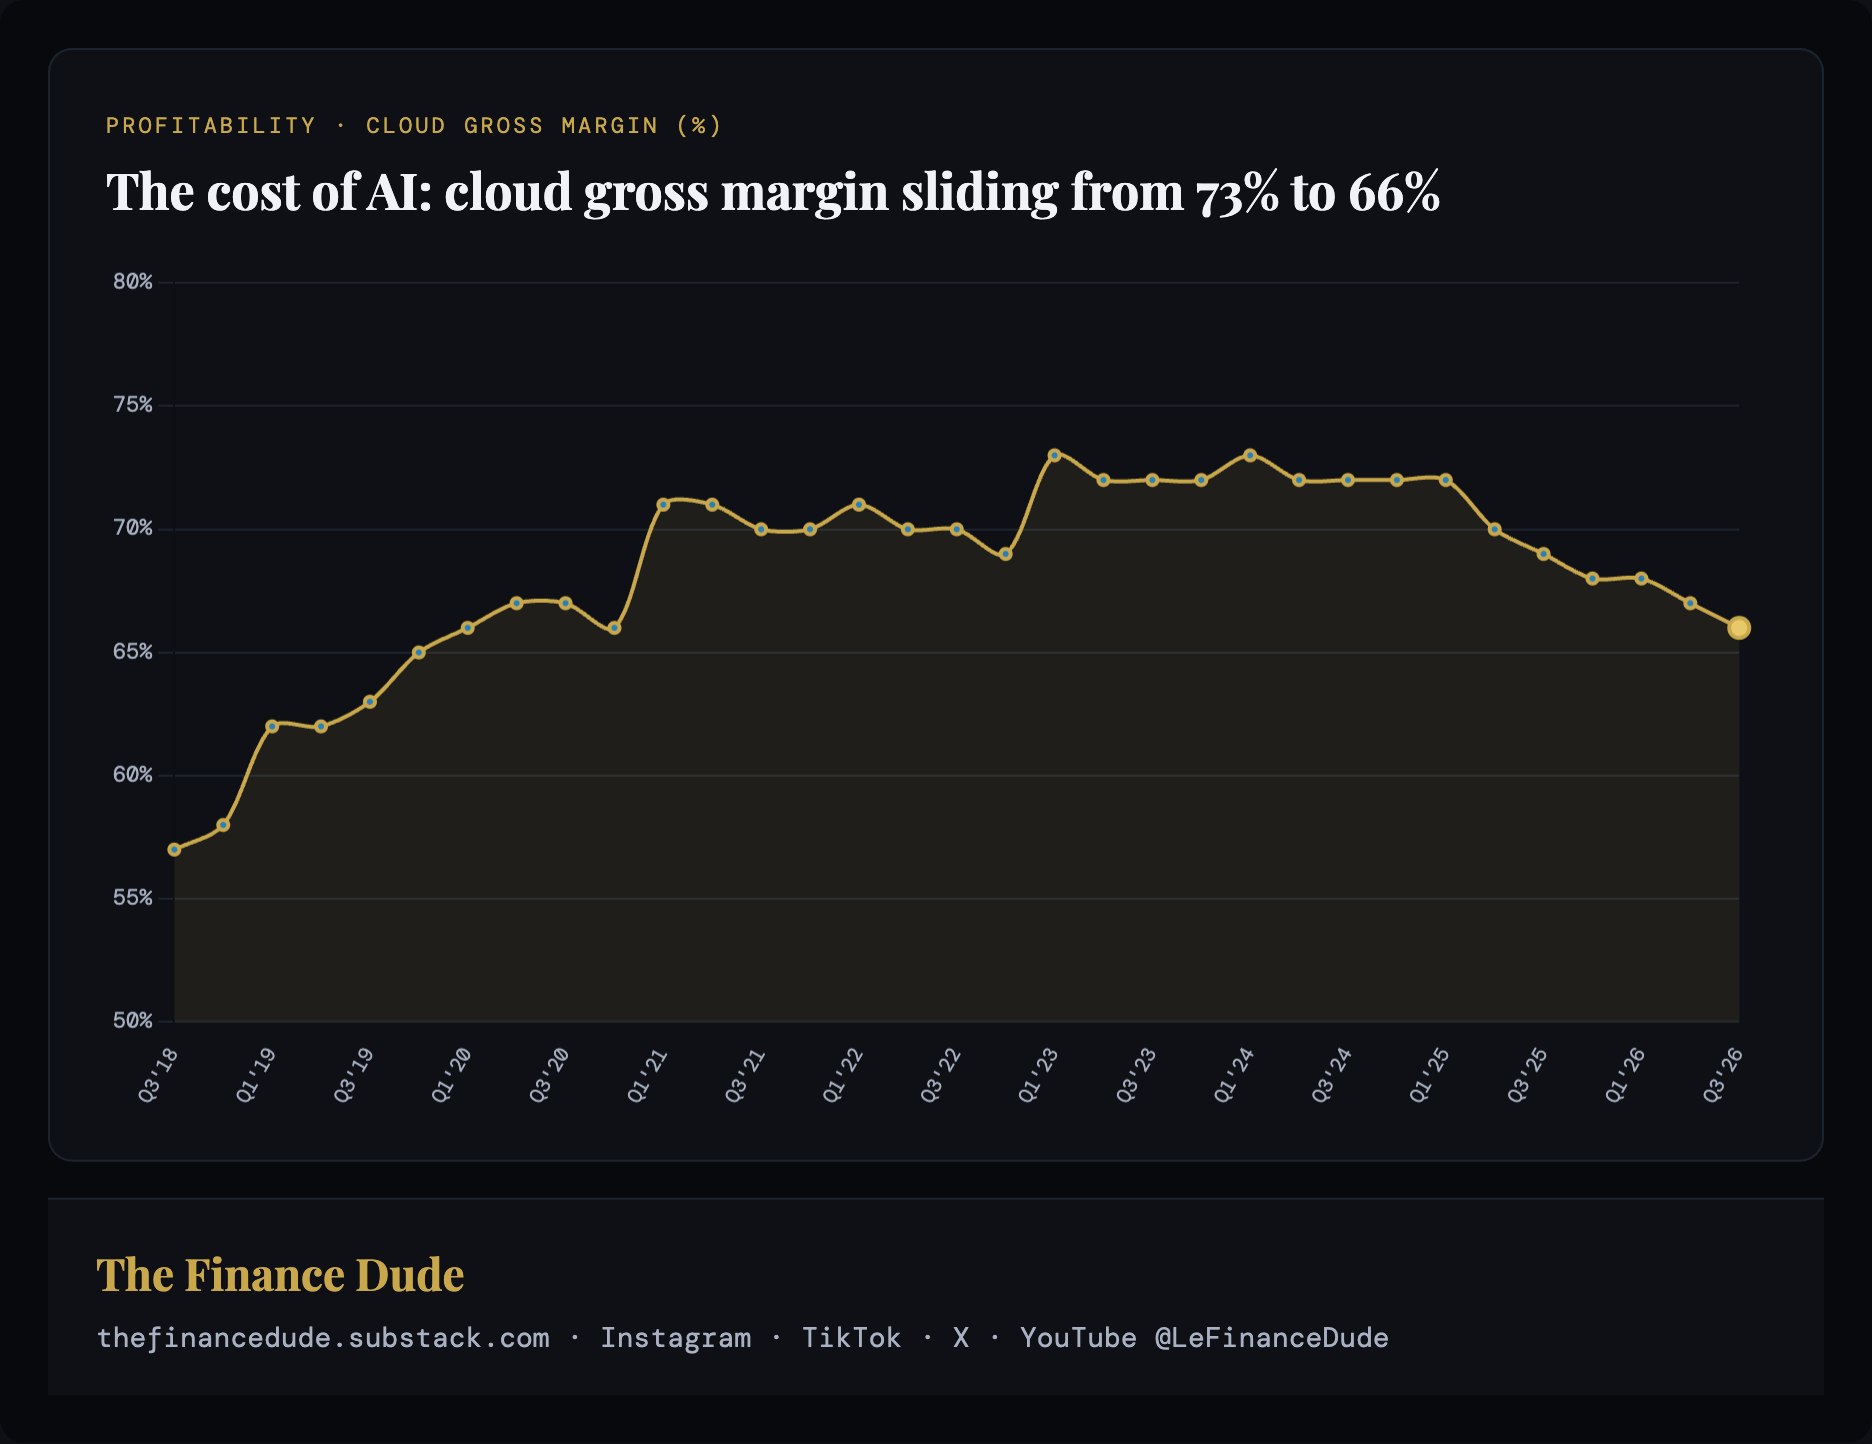
That scale carries a cost, and it sets up Pillar 4. Unit Economics: as compute-heavy AI services grow inside the cloud mix, Microsoft Cloud’s gross margin has slipped from about 73% to 66%. The driver is the cost of compute. Traditional software like Office has almost no marginal cost — once it’s built, serving one more user is nearly free, which is why software margins run so high. AI is the reverse: every unit of revenue carries real GPU time, power, and the depreciation of hugely expensive infrastructure behind it.
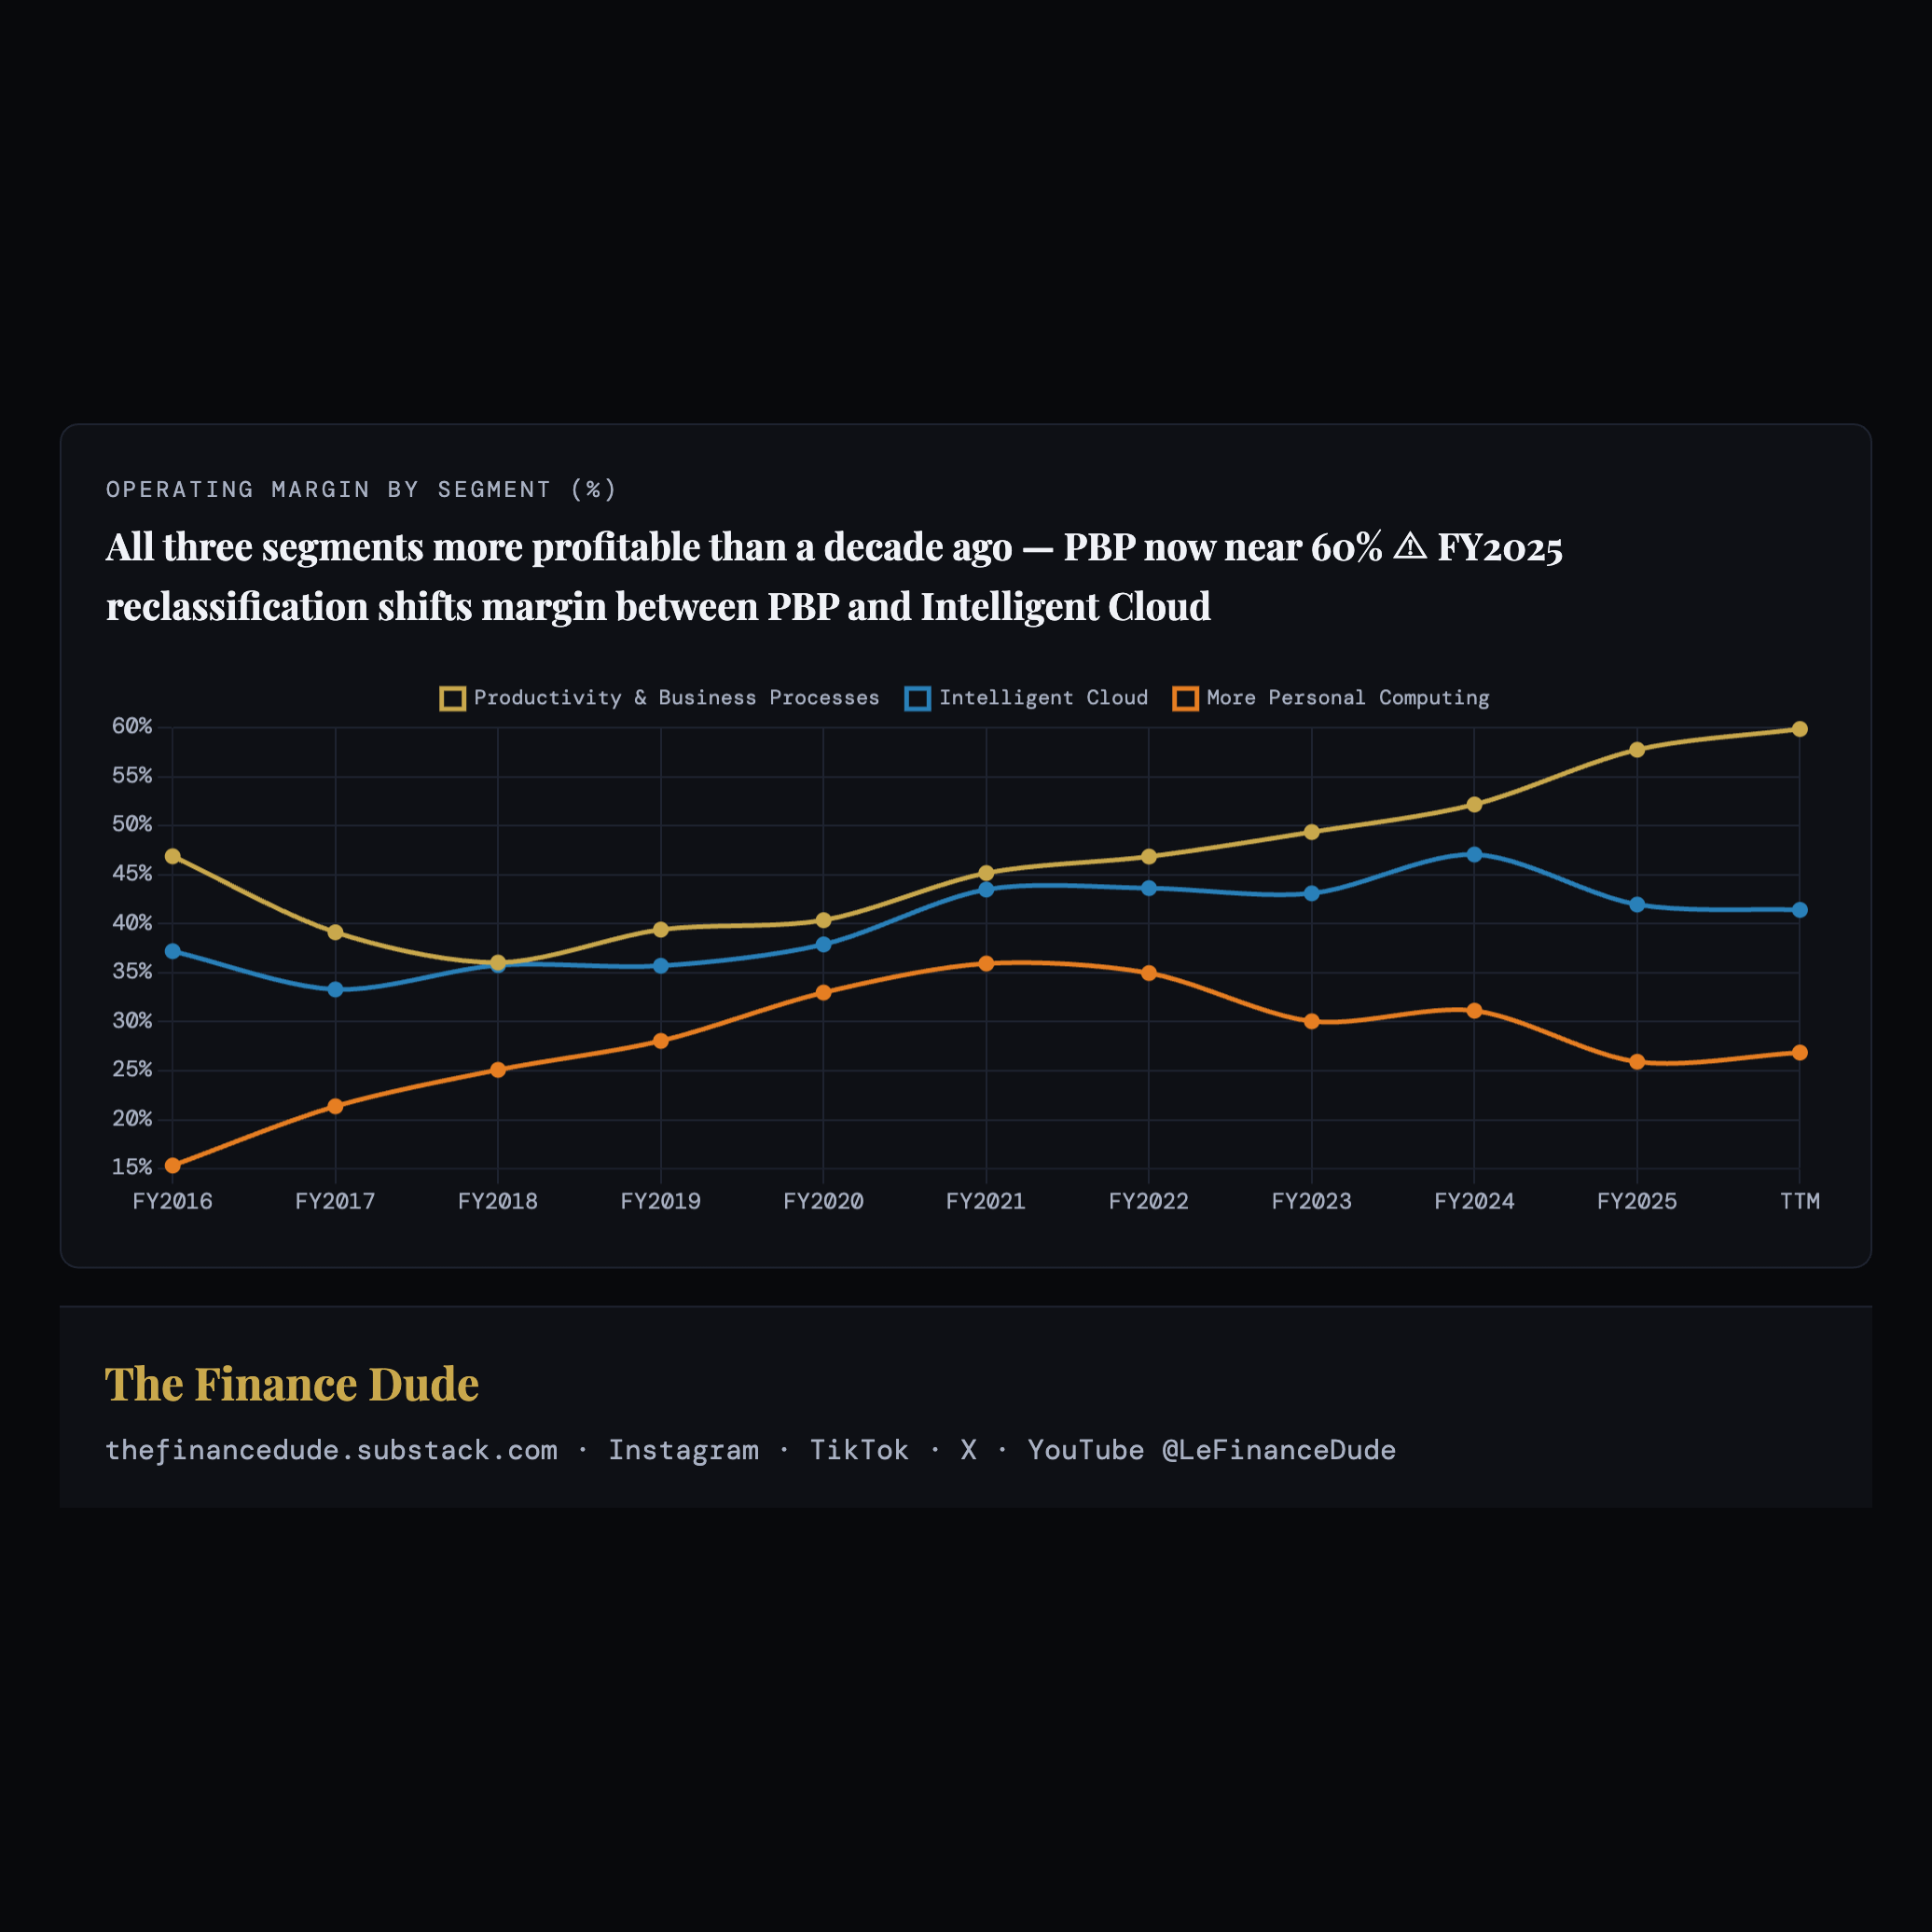
The profitability of each segment matters as much as its size, and all three have become structurally more profitable over the past decade. Productivity & Business Processes now earns the highest operating margin at roughly 60%, up from the mid-30s — making it both the largest and the most profitable segment. Intelligent Cloud runs at about 41%, having slipped from a ~47% peak in FY2024; that dip is largely a reclassification effect rather than an operational decline, because the FY2025 change consolidated high-margin commercial Microsoft 365 revenue into PBP. More Personal Computing sits at about 27%. The reclassification, in short, shifts reported margin between PBP and Intelligent Cloud — but the underlying improvement across all three segments is real.
What makes the model durable is that it’s predominantly recurring. The majority of revenue comes from subscriptions, cloud consumption, and multi-year enterprise agreements — a structure that provides high revenue visibility and powerful retention dynamics. Microsoft 365 Commercial alone serves hundreds of millions of seats globally, and Azure serves roughly 85% of the Fortune 500. Once a company runs its identity, email, and infrastructure on Microsoft, each additional product — Azure, then Security, then Copilot — sells into a relationship that is already paid for, which is why the incremental cost of selling the next product is so low.
Microsoft reaches that base through three motions: direct account teams for large enterprises, roughly 400,000 partners worldwide who resell and integrate into the mid-market and small business, and self-serve for the smallest customers — which keeps its cost of distribution low even at this scale.
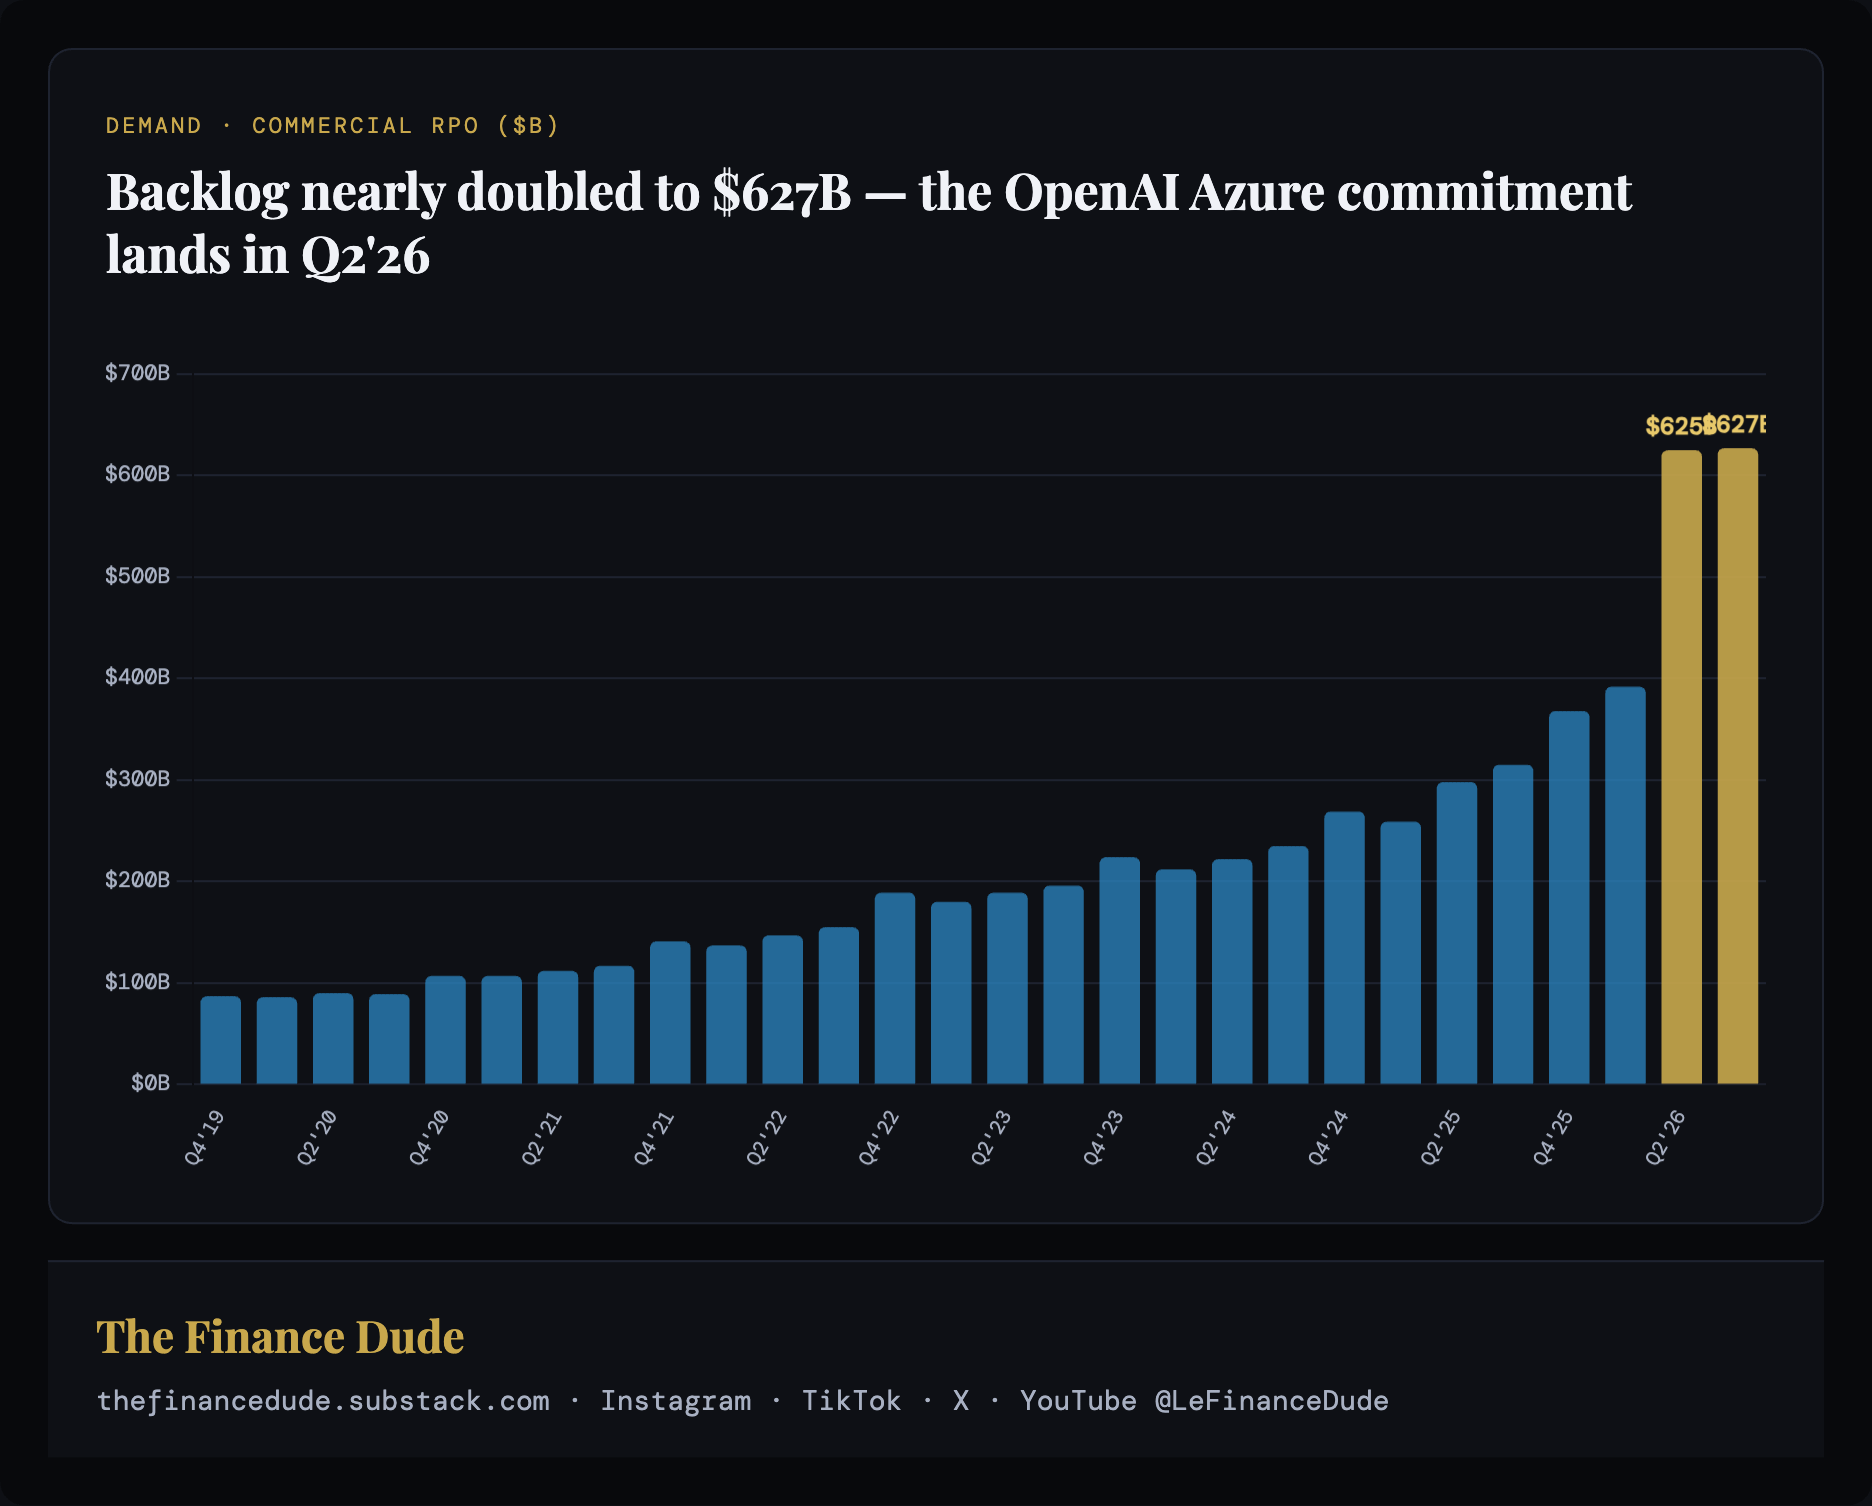
The clearest evidence that this model sells the future, not just the present, is the backlog. Commercial remaining performance obligations — contracted revenue not yet recognized — reached $627 billion, nearly double a year ago, as the OpenAI Azure commitment landed in the most recent quarters. Roughly a quarter converts to revenue within twelve months. That inverts the usual software question: not whether customers will buy, but whether Microsoft can build capacity fast enough to deliver what is already under contract — which is exactly where Pillar 4. Unit Economics gets uncomfortable.
Pillar 1 Score: 9/10 ✅
A clearly structured, predominantly recurring business with rare forward revenue visibility and a low-cost path to selling each new product into its installed base.
Pillar 2. Industry & Competition
Microsoft competes in more large markets at once than almost any company on earth — cloud, productivity, collaboration, enterprise applications, developer tools, security, gaming, and advertising — and ranks first or second in most of them. That breadth is itself a competitive fact: no single rival meets Microsoft across more than two or three fronts.
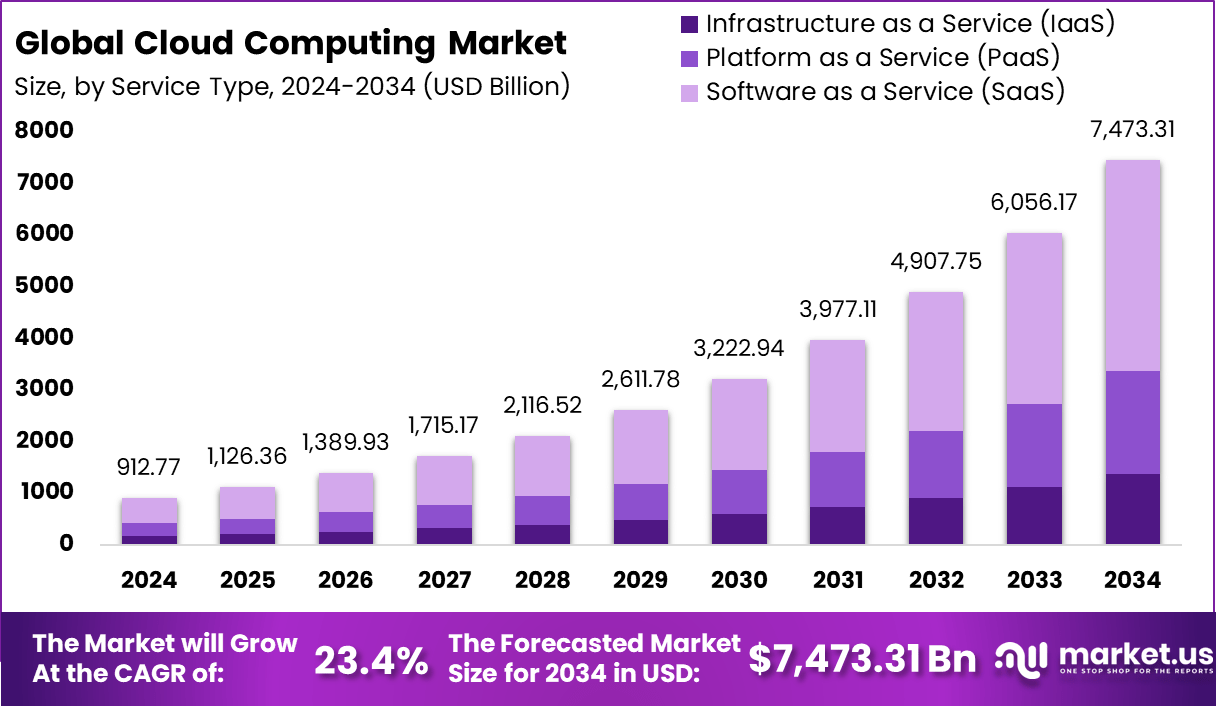
The dominant industry trend is the migration of enterprise computing to the cloud and, layered on top, to AI — a shift still early, with perhaps only 20–30% of enterprise workloads in the cloud so far. Global cloud spending is roughly $1.4 trillion today and is projected to reach $3 trillion by 2030 and $7 trillion by 2034, compounding about 23% a year. Enterprise AI sits on top of that and is scaling fast: AI software is already a ~$175 billion market growing around 25% annually, and hyperscaler AI capital spending is expected to exceed $700 billion in 2026.
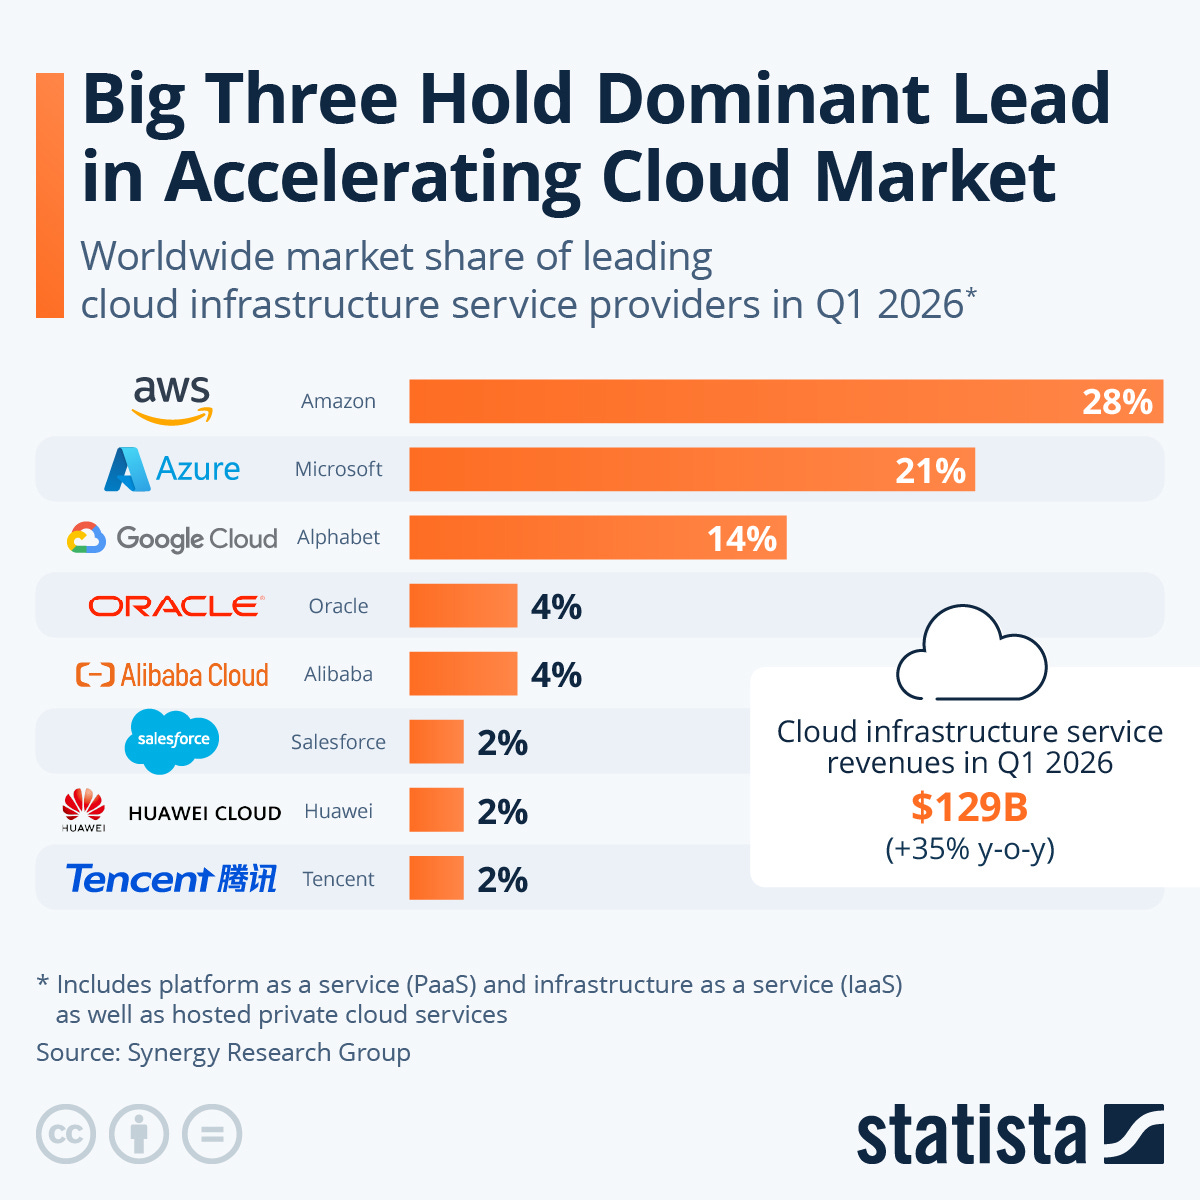
Cloud infrastructure is the central battleground and a natural oligopoly — the capital required to build hyperscale data centers keeps the field small. Amazon Web Services leads at roughly 28% global share, Microsoft Azure is second at about 21%, and Google Cloud third at about 14% — together more than 60% of the market. The telling detail is growth: in the most recent quarter Azure grew about 40%, AWS reaccelerated to 28% (its fastest in nearly four years), and Google Cloud led at about 63%. Azure is still growing faster than the market leader, while Google — armed with its own Gemini models and TPU chips — is outpacing both, which is why Microsoft is building its own silicon (the Maia accelerator and Cobalt CPU). AWS counters with Bedrock and its Trainium/Inferentia chips; all three are racing on custom hardware to control the cost of AI.
Beyond cloud, the competitive map runs across every layer of enterprise software:
Productivity & collaboration. Microsoft 365 is the enterprise default; its main challenger is Google Workspace, strong in small business and education but a distant second up-market. In messaging, Teams (320M+ monthly users) long ago overtook Slack (now part of Salesforce), helped by being bundled into Microsoft 365 — the same bundling now under regulatory scrutiny (Pillar 9).
Enterprise applications (ERP/CRM). Dynamics 365 is a challenger, not a leader: Salesforce dominates CRM (~22% share) and SAP dominates large-enterprise ERP. Microsoft gains share mainly by discounting Dynamics inside larger Microsoft 365/Azure deals and out-shipping rivals on AI features.
Developer tools. GitHub is the dominant code platform with 150M+ developers, and GitHub Copilot was the first major AI coding assistant (more than 1.8 million paid customers). But this is now the most contested AI battleground of all — Cursor, Anthropic’s Claude Code, and Google’s Gemini Code Assist are taking developer mindshare quickly, and coding is the use case with the lowest switching costs. Microsoft’s edge is distribution (every GitHub user is a prospect); its risk is that the best coding tool, not the default one, wins.
Security. Microsoft is the largest security vendor on earth at over $20 billion, competing across endpoints (Defender vs CrowdStrike), SIEM (Sentinel vs Splunk), and identity (Entra vs Okta), with Palo Alto and Zscaler in network security. Its advantage is integration — one console across Windows, Azure, and Microsoft 365 — and the industry’s drift toward vendor consolidation favors exactly that.
Gaming. After the Activision acquisition, Microsoft is the third-largest gaming company (behind Tencent and Sony). Sony and Nintendo still lead on consoles and exclusive content; Microsoft’s differentiation is Game Pass and a multiplatform, cloud-gaming strategy rather than hardware wins.
The disruption question — whether cheap, open-source AI models erode Microsoft's position — splits into two distinct risks:
Margin Pressure: as model performance commoditizes and token prices fall, the premium on any single model compresses. This is survivable, because those models still run on cloud infrastructure, and on Azure they generate consumption regardless of who built them. Microsoft’s Foundry platform deliberately offers OpenAI, Anthropic, and open-source models side by side, and usage of the non-OpenAI models doubled quarter-over-quarter.
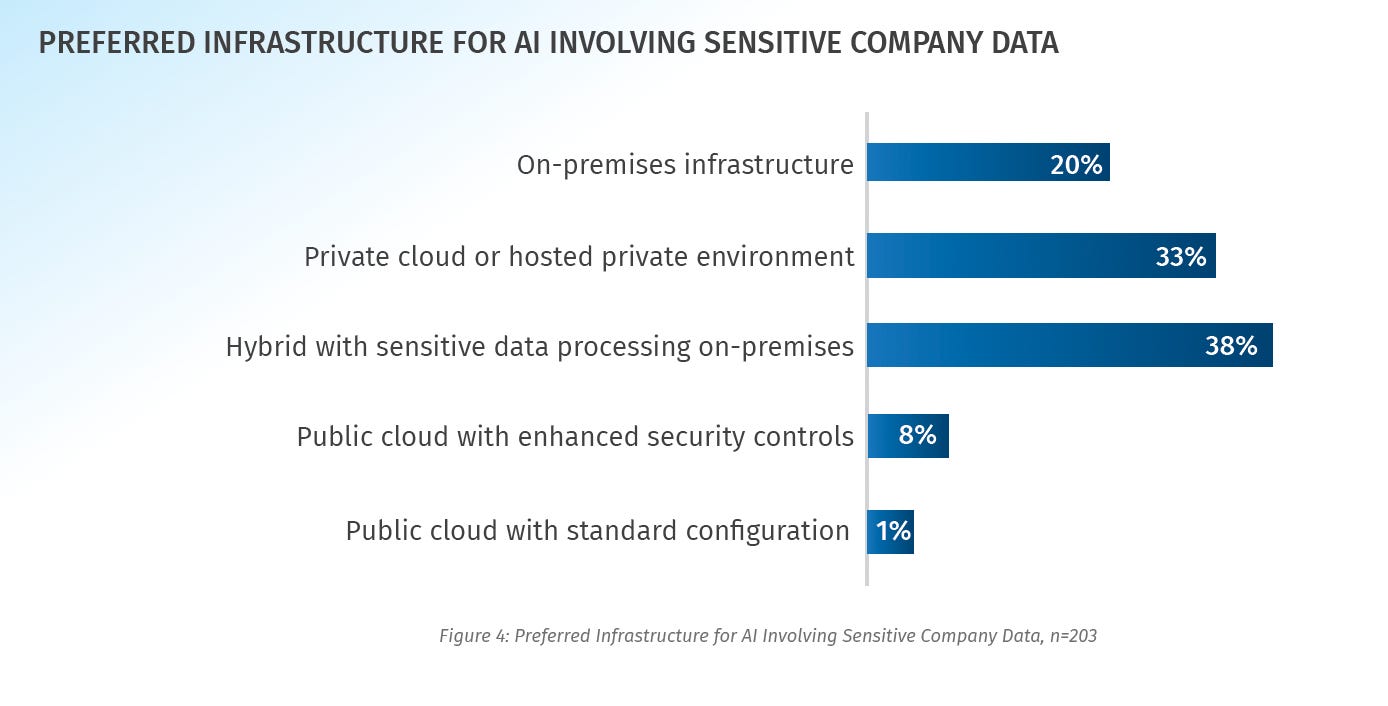
A far more serious risk would be displacement of the Azure platform itself. The real risk isn’t a new entrant — it’s enterprises partially repatriating AI workloads. Independent surveys (IDC, Barclays) show the majority of CIOs planning to move at least some workloads back on-premises, driven by AI cost economics: running continuous inference at public-cloud prices is expensive for steady-state workloads.
Pillar 2 Score: 8/10 ✅
A leading position across an unmatched breadth of markets, held below higher by Google Cloud's faster growth, the intensifying contest in AI coding tools, and the steady downward pressure on AI model economics.
Pillar 3. Competitive Advantage (Moat)
Microsoft’s competitive advantage rests on five reinforcing moats, and the AI transition is currently widening them rather than eroding them.
Switching Cost: most large enterprises already run their identity (Microsoft Entra, formerly Active Directory), email, documents, and increasingly their cloud on Microsoft, and replacing that stack is a multi-year migration with significant operational risk, not a procurement decision. The stickiest version is the regulated tier — Azure Government and Azure for Healthcare carry compliance certifications (FedRAMP and the like) and data-residency guarantees that make switching close to unthinkable, and the revenue attached is among the most durable Microsoft has.
Ecosystem Bundling: each product lowers the cost of selling the next (the mechanism from Pillar 1). The clearest proof is Microsoft Security: the largest security business in the world at over $20 billion and growing about 30% a year, sold almost entirely into the existing base, and reinforced by a threat-data advantage (billions of endpoints, trillions of daily signals) that standalone vendors cannot match.
Infrastructure Scale: a global data-center and GPU fleet, funded by roughly $190 billion of planned annual capital spending just for calendar year 2026.
Privileged Access to Frontier AI models: Microsoft’s partnership with OpenAI, backed by a reported ~$13 billion of investment, gave it early and preferential integration of leading models across Azure, Copilot, and Bing. This is the most qualified of the five — exclusivity has loosened as OpenAI builds its own infrastructure and moves toward an IPO (the risk detailed in Pillar 9) — but the head start in enterprise-AI distribution is real, and Microsoft hedges it by offering its own and rival models on Foundry.
The fifth moat is the newest and the most important for the next decade: Proprietary Enterprise Data and Context: Microsoft’s “Work IQ” — the organizational knowledge layer beneath Copilot — spans roughly 17 exabytes of customer data and grows about a third each year, drawn from the emails, documents, and meetings already stored in Microsoft 365. A competitor can match a model’s capabilities; it cannot replicate a customer’s accumulated context inside Microsoft’s security and compliance boundary. This converts the distribution flywheel into something closer to a data network effect: each agent an organization builds on Work IQ raises the cost of leaving. Nearly 90% of the Fortune 500 already run agents built with Microsoft’s tools — the installed base entrenching itself one layer higher in the stack.
Two developments could weaken the moat:
Regulation: targeting the bundling that ties the products together (see Pillar 9).
On a longer horizon, is a Platform Shift in which AI agents access enterprise data directly and bypass the Microsoft 365 interface (already covered above: enterprises partially repatriating AI workloads) — which is precisely why Microsoft is investing to own that interface itself, through Work IQ and the Foundry agent platform.
Pillar 3 Score: 9/10 ✅
A multi-layered, compounding moat that AI is reinforcing on most fronts. Only the softening OpenAI exclusivity, regulatory action, and a long-term interface shift keep it below a perfect score.
Pillar 4. Unit Economics
(Raw financial data for this pillar sourced from StockAnalysis.com — use code THEFINANCEDUDE10 for 10% off the Pro plan.)
Microsoft’s unit economics are among the best in software, but a large capital-spending cycle has temporarily broken the link between profit and cash. Both facts hold at once, and reconciling them is the central question of the company today.
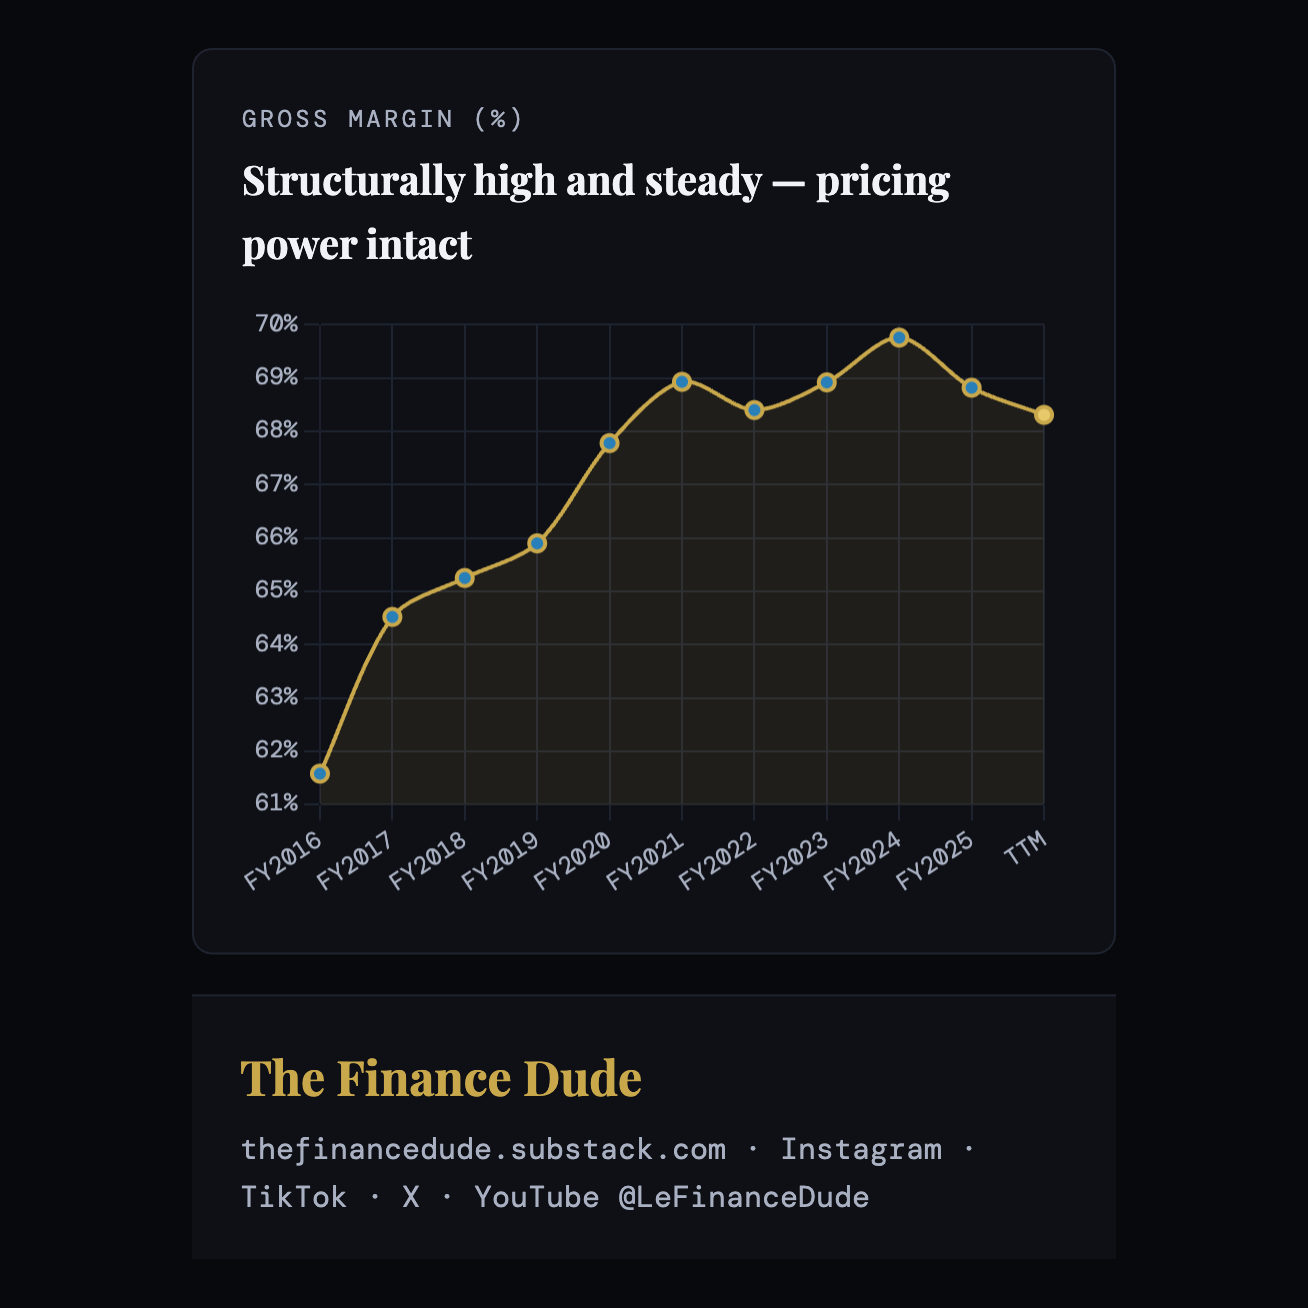
Start with profitability, because it is the strongest part of the story. Gross margin is about 68%, up from roughly 62% a decade ago and sitting near its all-time high — direct evidence of pricing power, because Microsoft has raised prices and shifted its mix toward software without giving margin back.
Operating margin carries the leverage story. It has climbed from roughly 25% in FY2016 to about 47% today.
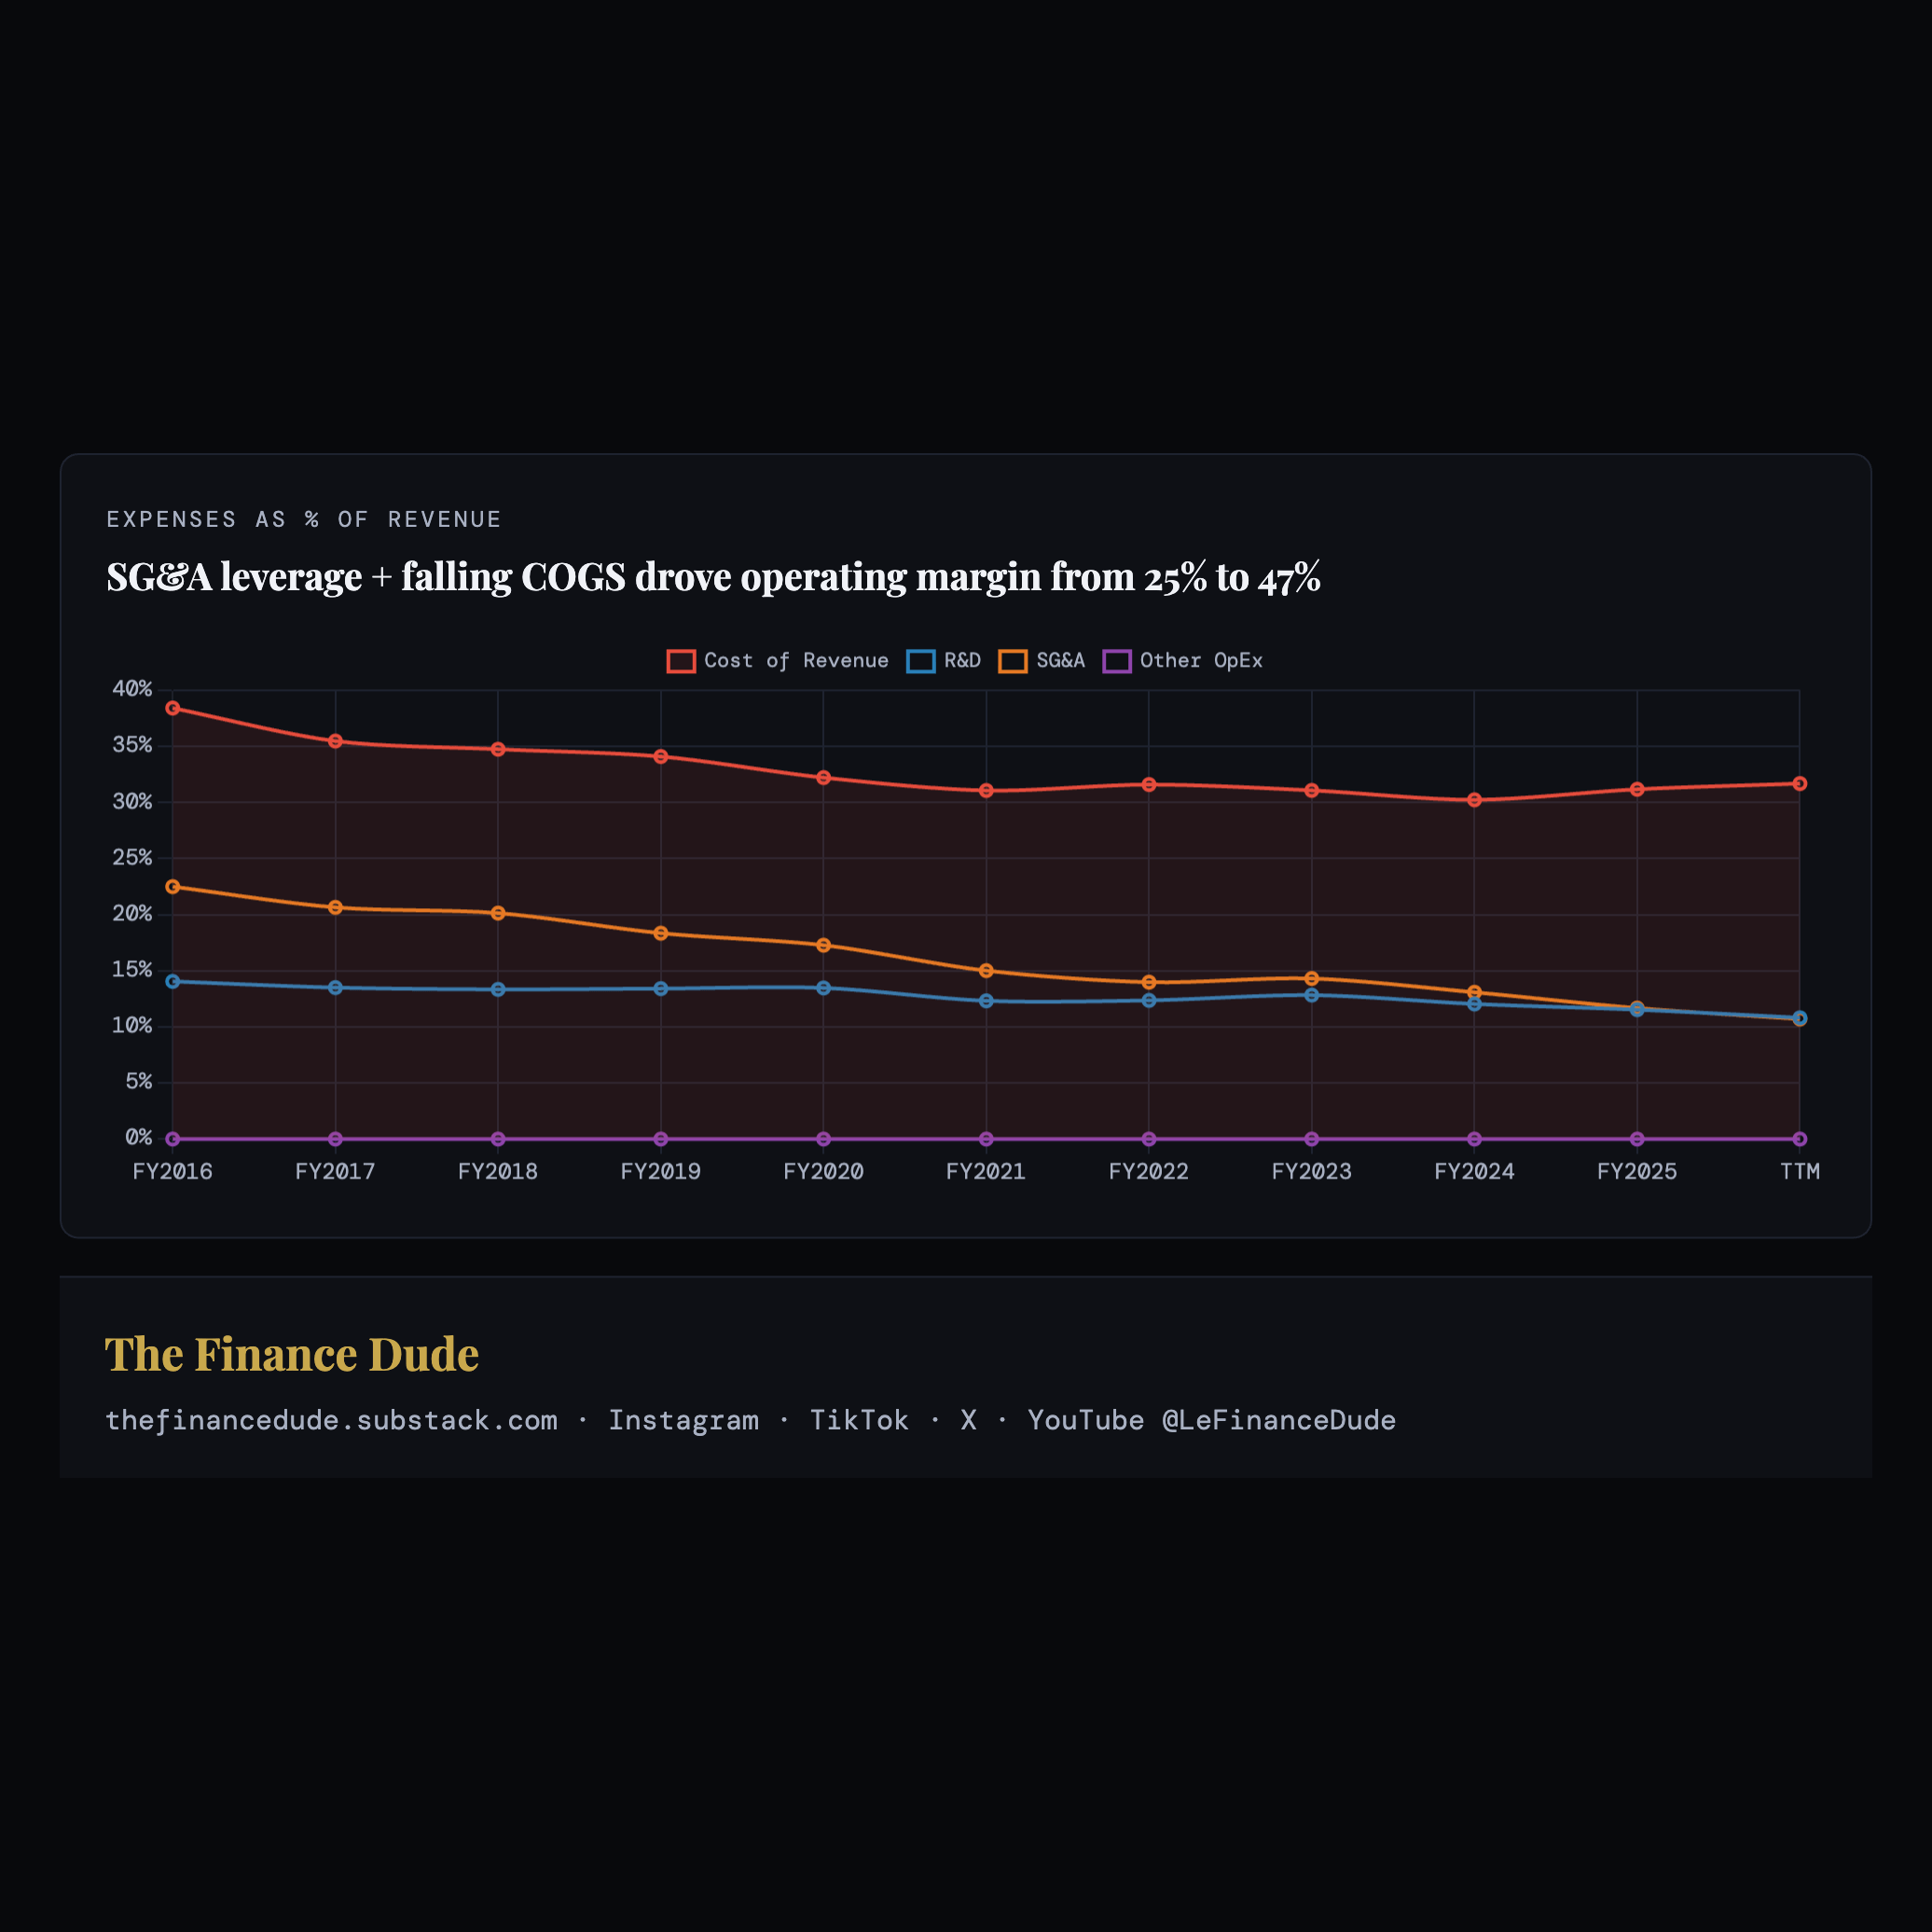
The cause is visible in the individual cost lines: cost of revenue has fallen from about 38% of sales to roughly 31%, SG&A from about 22% to roughly 11%, and R&D has held near 11% even as the company more than tripled in size.
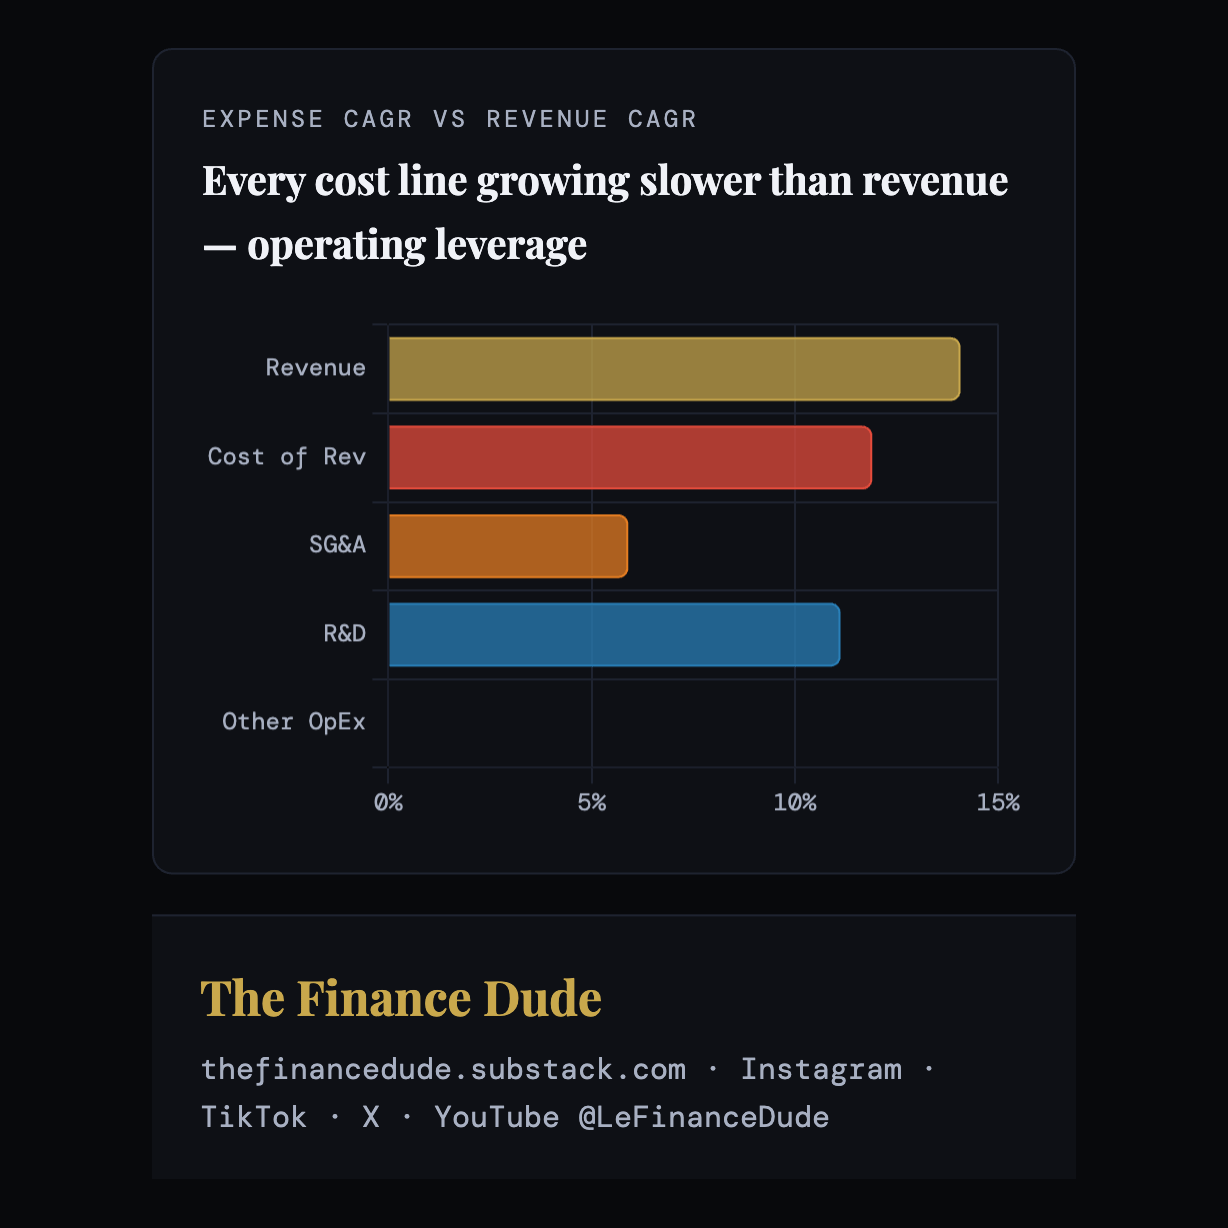
Put differently, revenue has compounded about 14% a year while no major expense line has grown faster than about 12% — every cost line growing slower than revenue is the precise definition of operating leverage, and the reason margin keeps expanding without any single dramatic event.
The cash side is where the pressure shows.
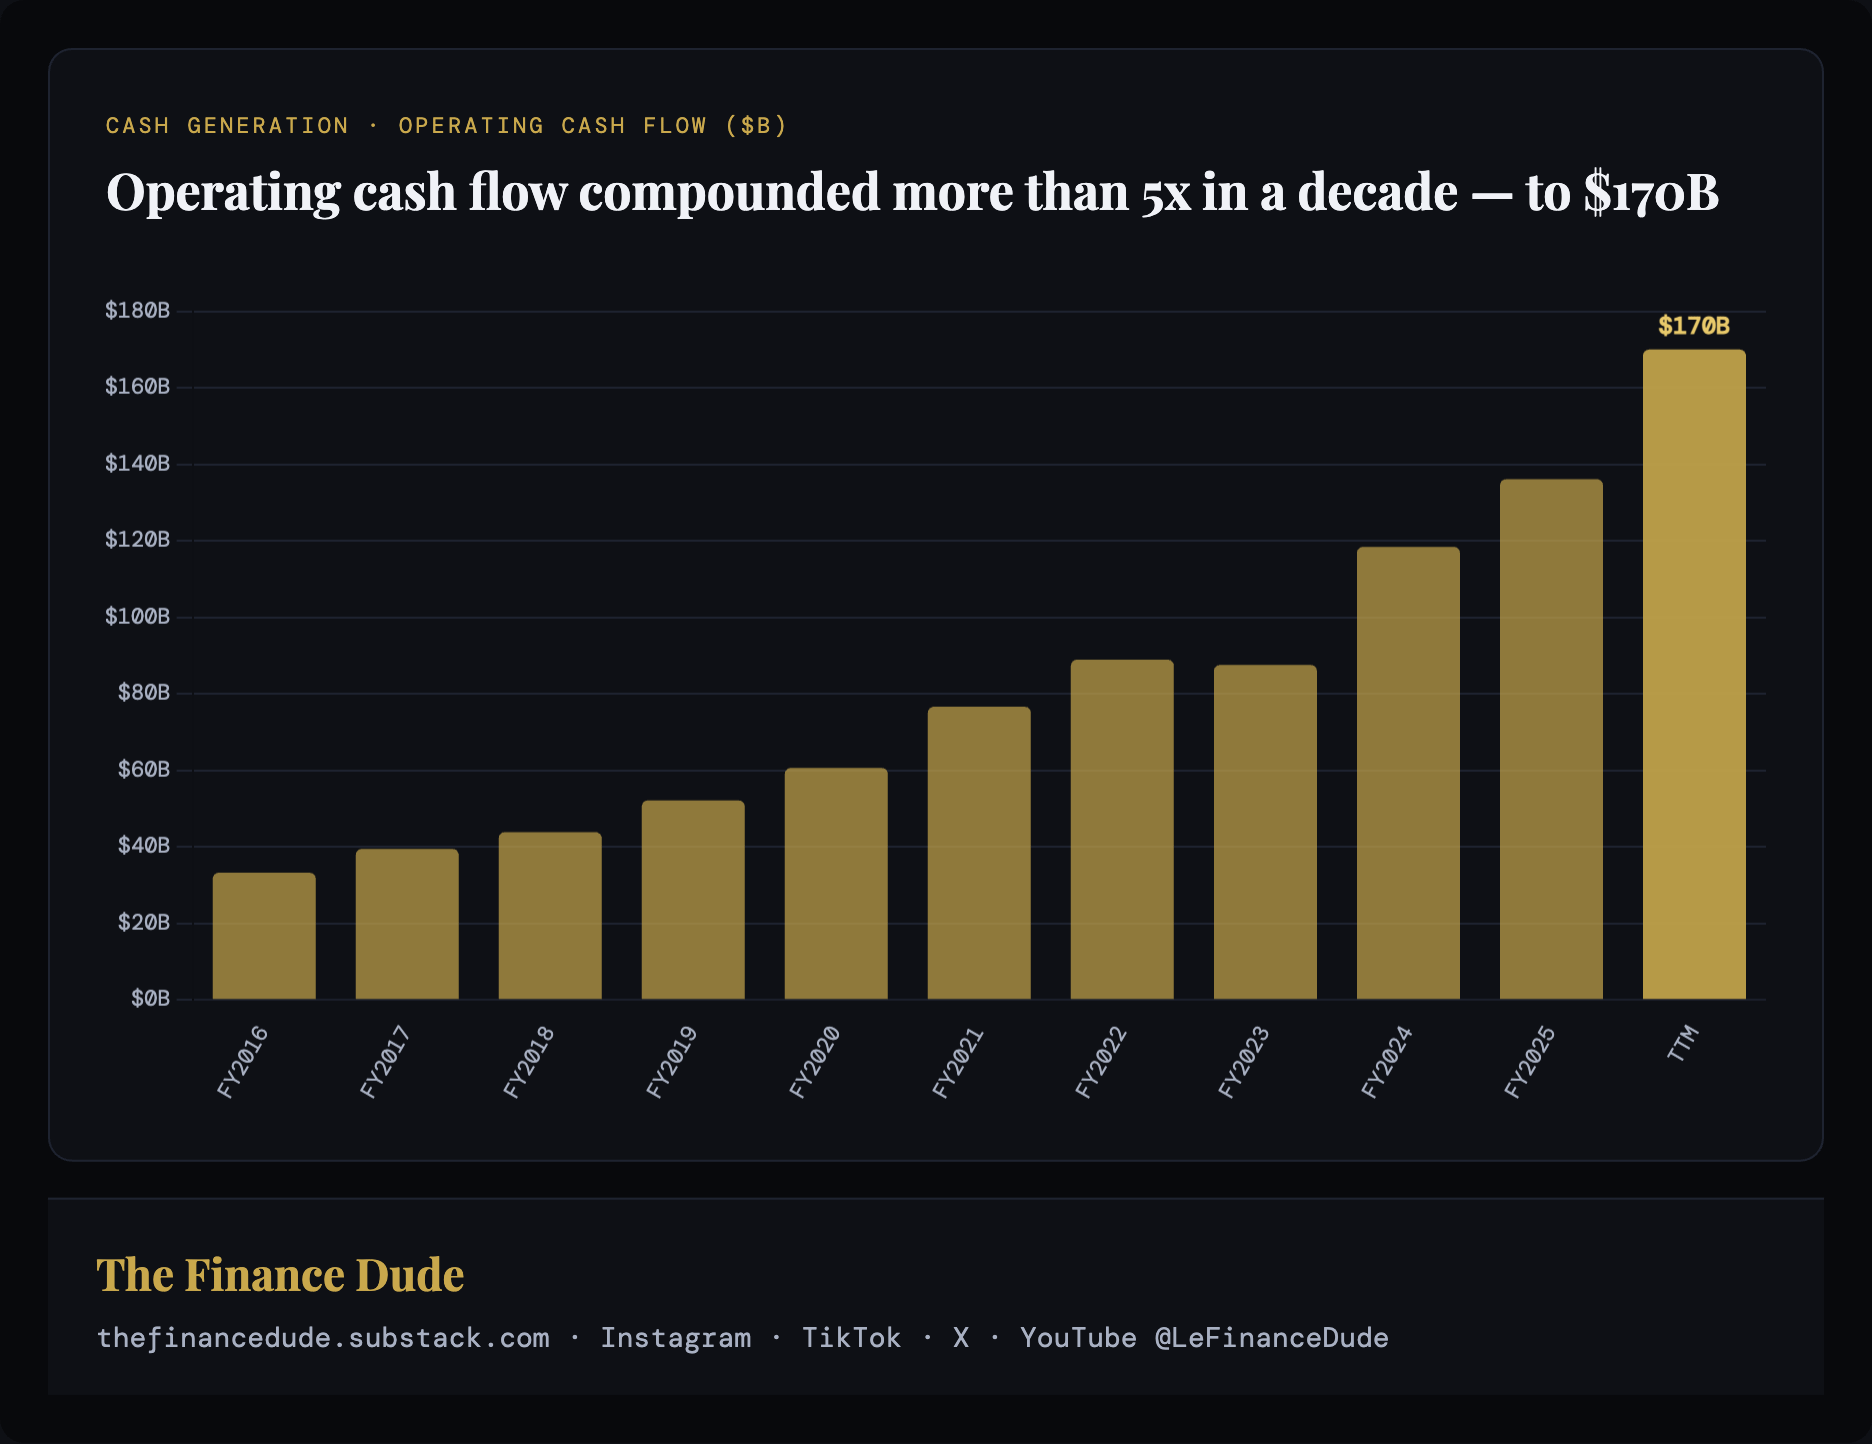
Operating cash flow has compounded relentlessly — from $33 billion in FY2016 to about $170 billion on a trailing basis, more than five times larger in a decade.
What now sits between operating cash flow and free cash flow is the issue.
Capital expenditure has gone from about $8 billion a decade ago to roughly $97 billion on a trailing basis — nearly twelvefold! And Microsoft plans to spend roughly $190 billion on data centers and chips in calendar 2026 alone.
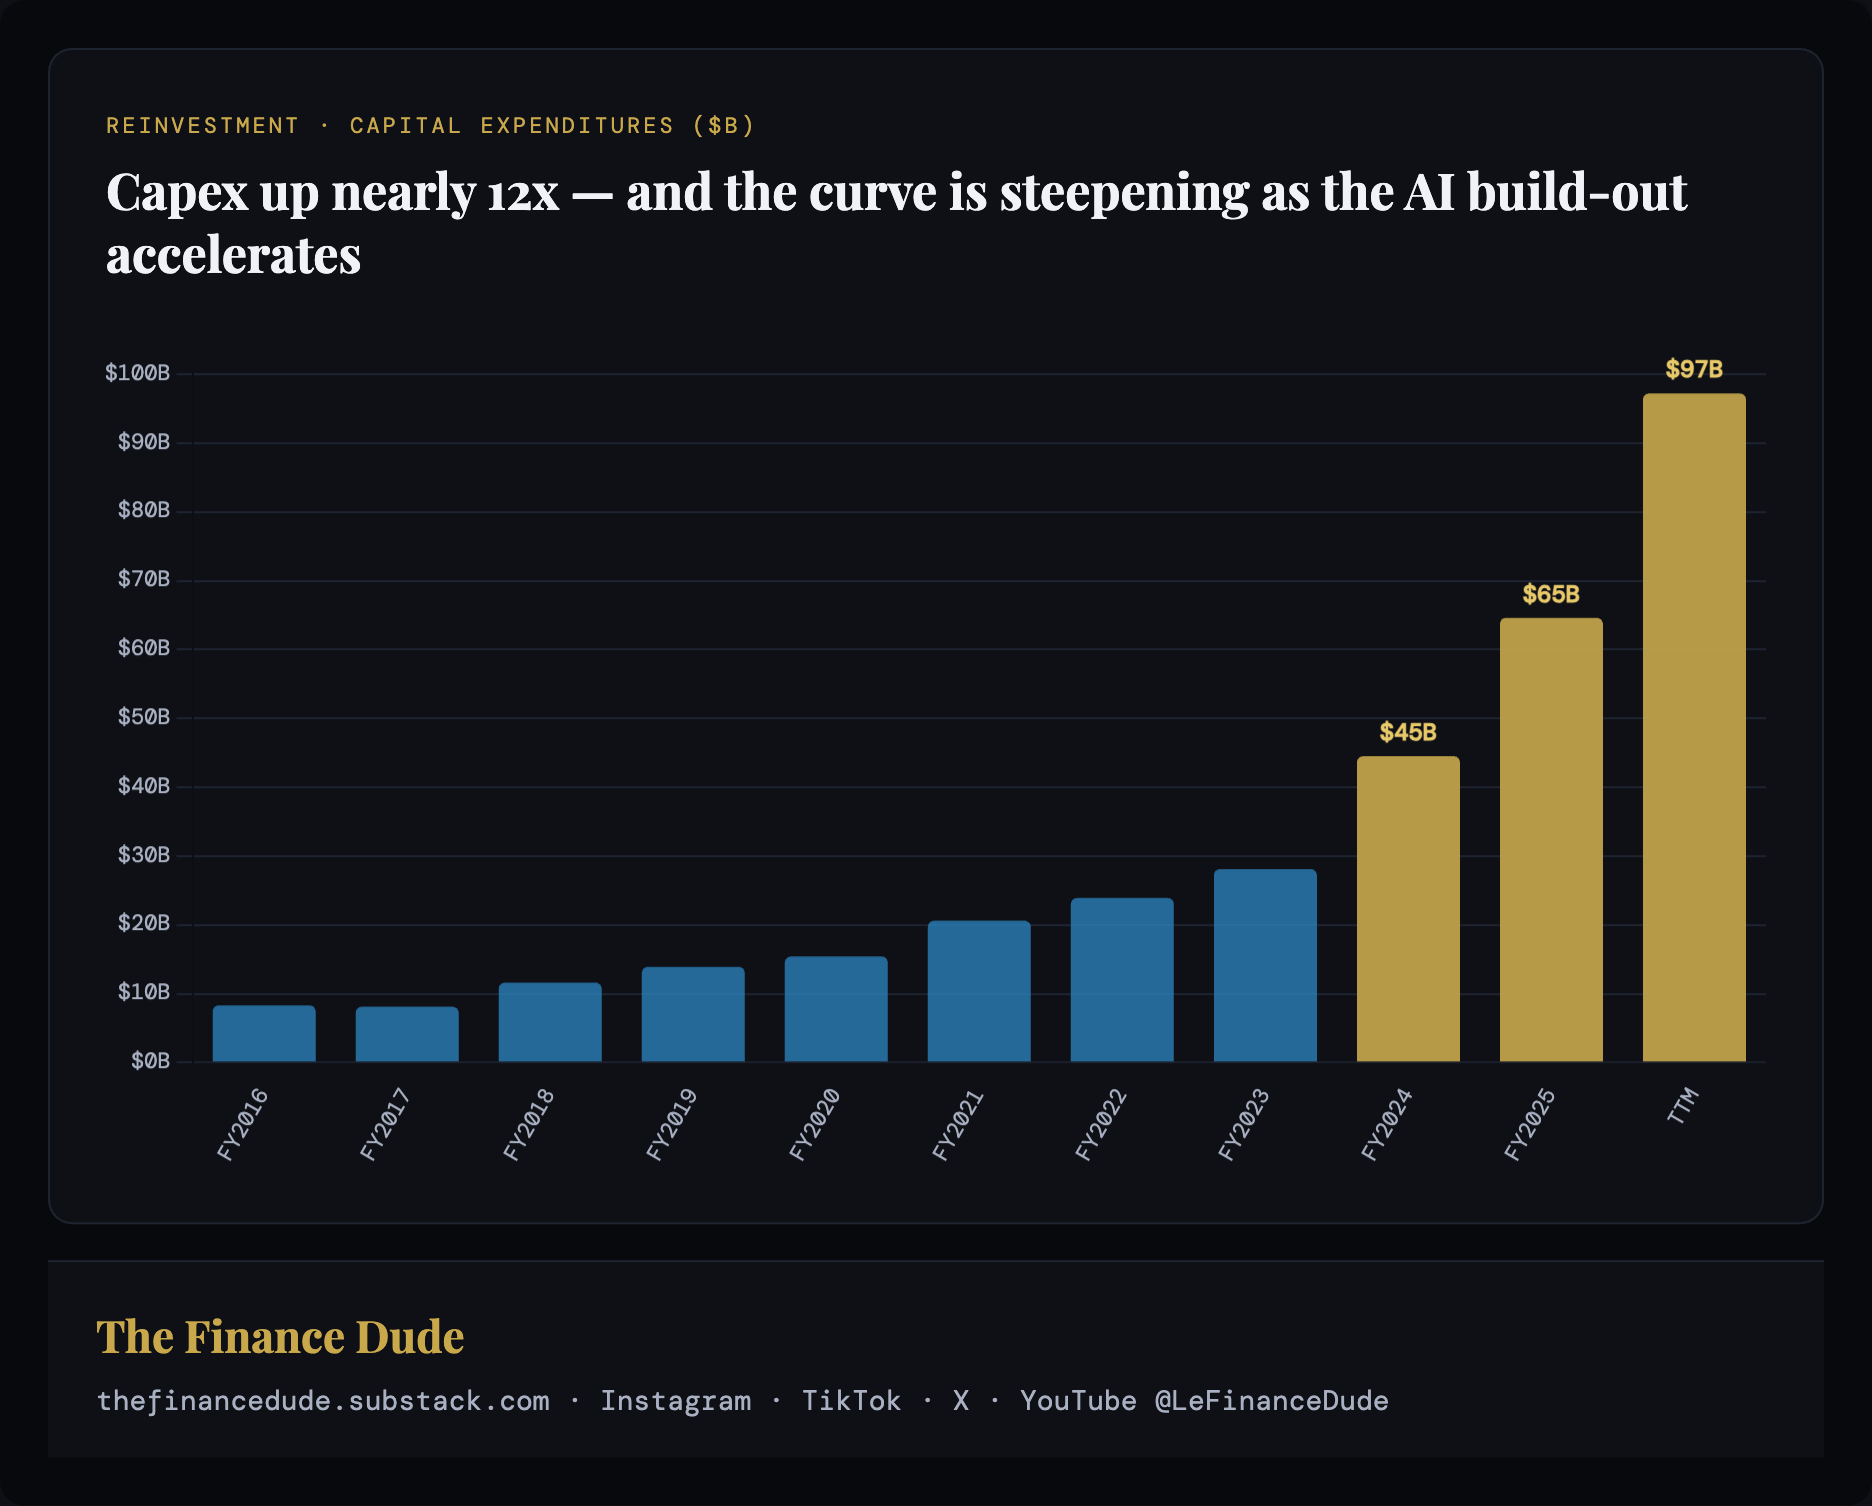
The result is a squeeze on cash conversion. Trailing free cash flow is still substantial at about $73 billion — a 23% margin — but the trajectory is compressing fast: in the most recent quarter, $30.9 billion of capital spending against $46.7 billion of operating cash flow left only $15.8 billion of free cash flow — just a 19% margin. The single cleanest picture of this is cash conversion, free cash flow as a share of net income, which has fallen from 139% in FY2016 to 58% today.
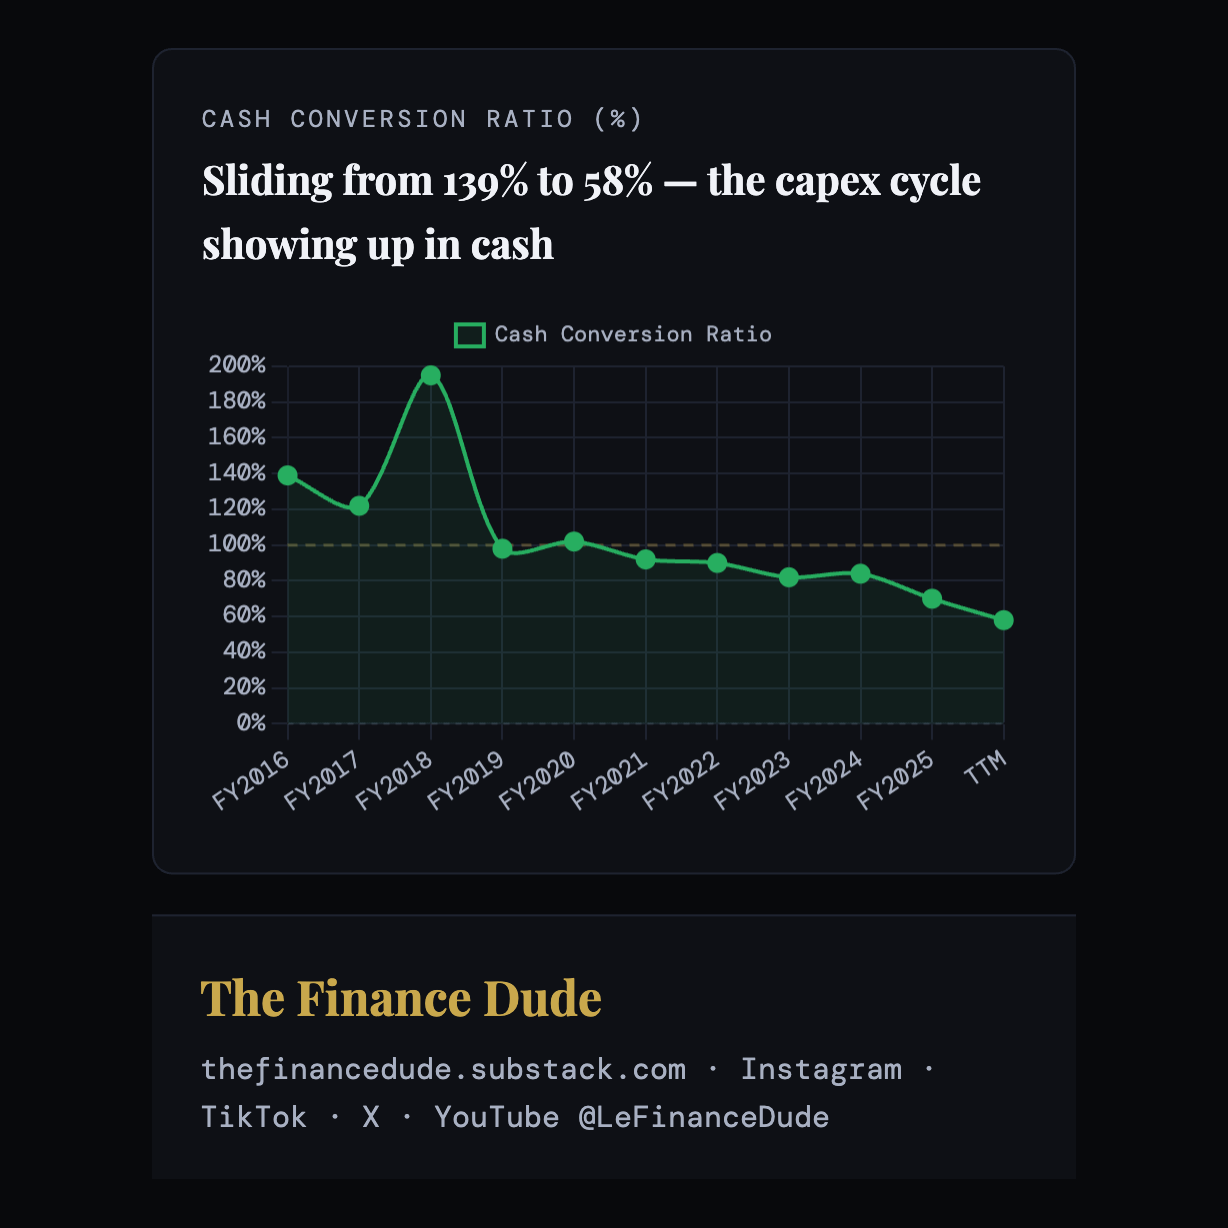
Microsoft is turning a far smaller share of its profit into spendable cash. But the important take is not because the profit is weaker, but because it is reinvesting at a historic rate.
About two-thirds of that spending is short-lived assets (GPUs and servers) rather than long-lived buildings, which is exactly what makes the depreciation question sharp.
Whether that compression is a problem depends entirely on the return on the spending. The capital is being deployed against the $627 billion of contracted demand established, as we saw in Pillar 1, which argues that capacity is being built to fill orders already signed. The counter-argument is that the assets depreciate quickly and cloud gross margins are already falling — from about 73% to 66%, the decline introduced in Pillar 1 — so the eventual return is real but still unproven.
The resolution is a question of price, which Pillar 10 addresses.
Pillar 4 Score: 8/10 ✅
Elite, structurally improving margins and high returns on capital, set against genuinely compressed free cash flow while the capital cycle runs ahead of its payoff.
Pillar 5. Balance Sheet Strength & Financial Resilience
Microsoft’s balance sheet is among the strongest of any company in the world. It holds about $78 billion in cash and investments against roughly $40 billion of total debt, leaving it in a net cash position.
Net debt to EBITDA is 0.04 times — effectively zero, and down from nearly 2 times a decade ago. Microsoft is one of only two U.S. companies (with Johnson & Johnson) to hold a AAA credit rating, which lets it borrow more cheaply than most sovereign governments. Solvency is not a meaningful risk under any realistic scenario.
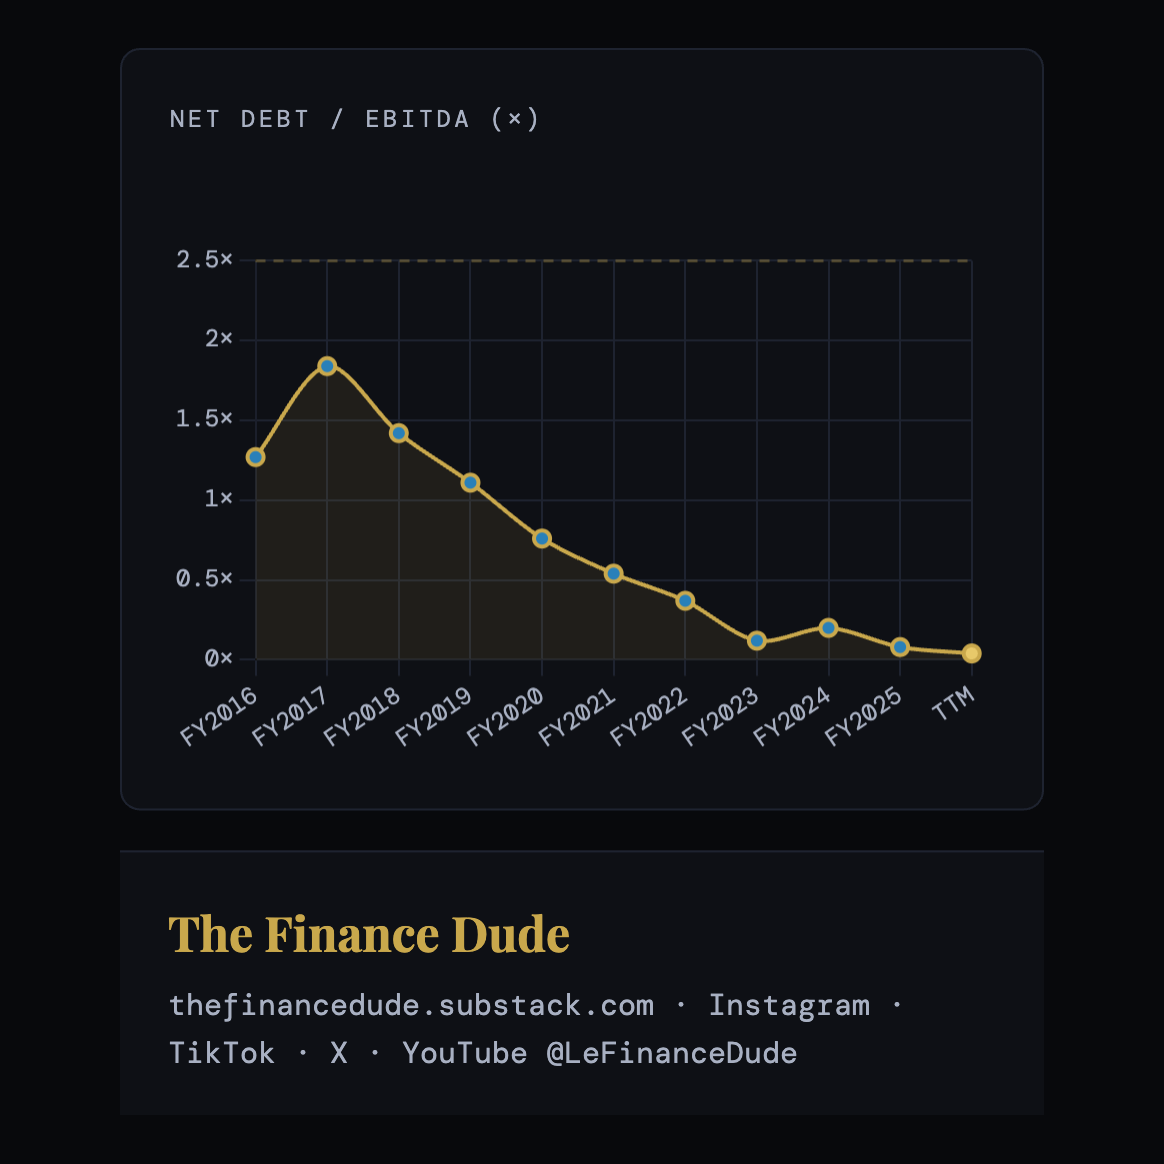
Every other leverage measure tells the same story and points the same direction.
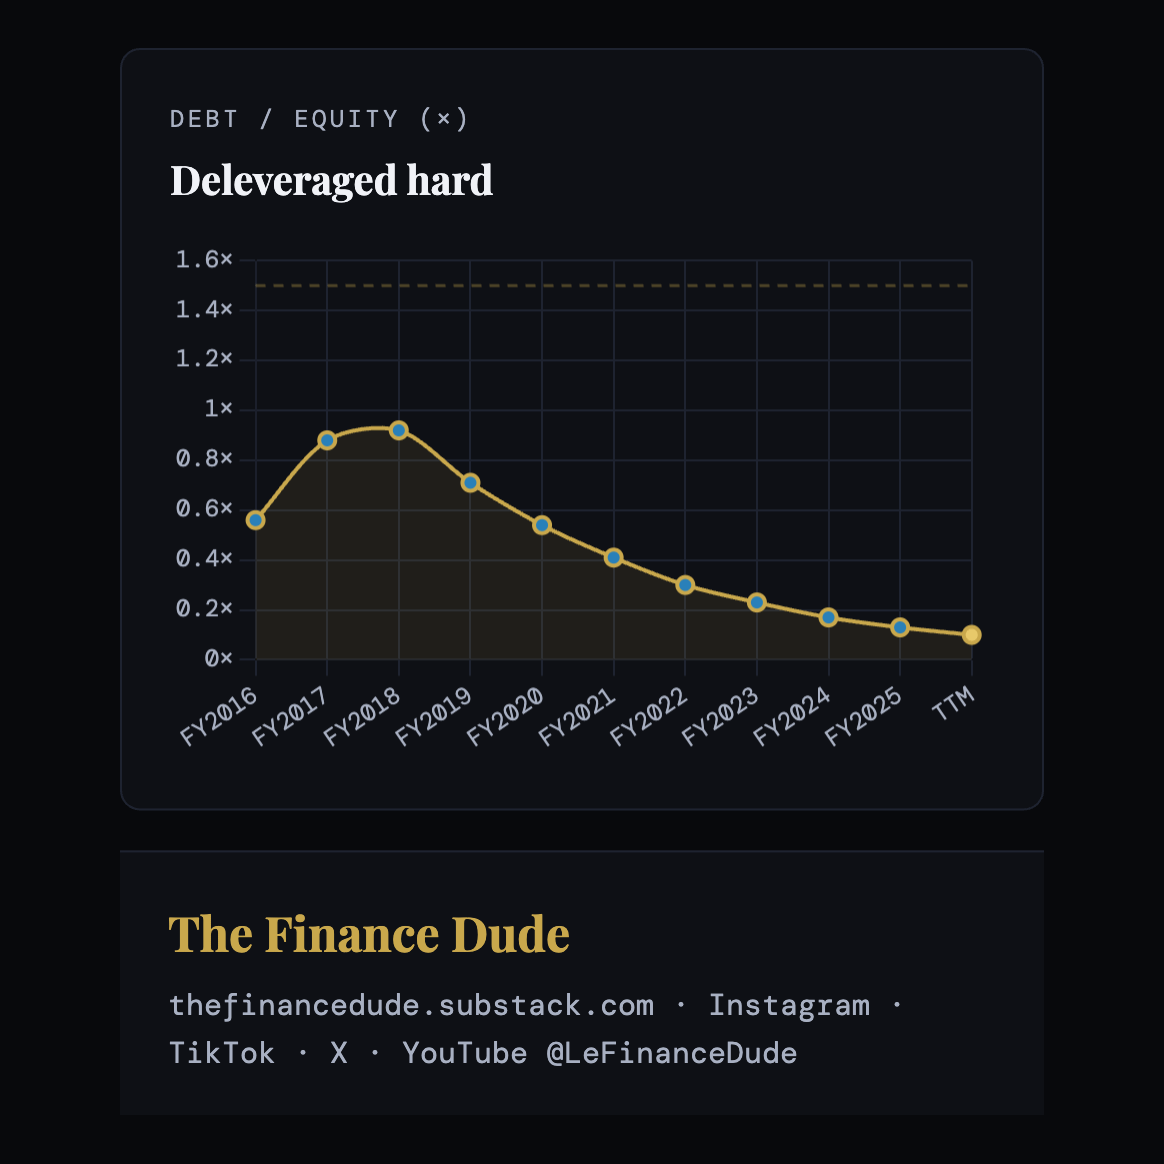
Debt-to-equity has fallen from a peak near 0.9 times in FY2018 — the years Microsoft carried debt to fund LinkedIn — to about 0.1 times today.
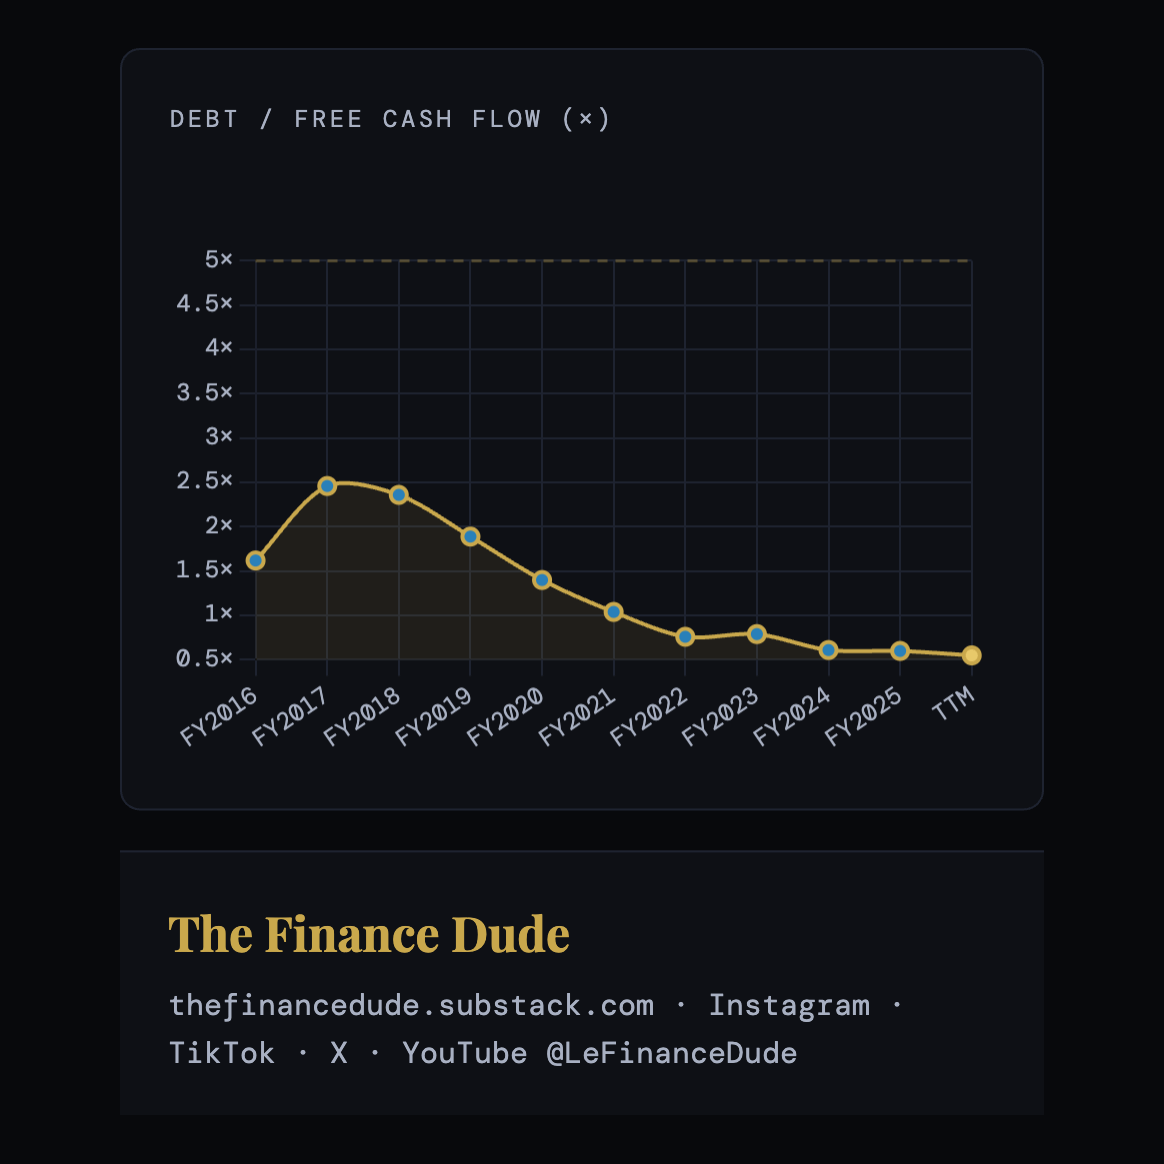
And total debt is now less than 0.6 times a single year’s free cash flow, meaning the company could clear its entire debt load in roughly seven months of cash generation.
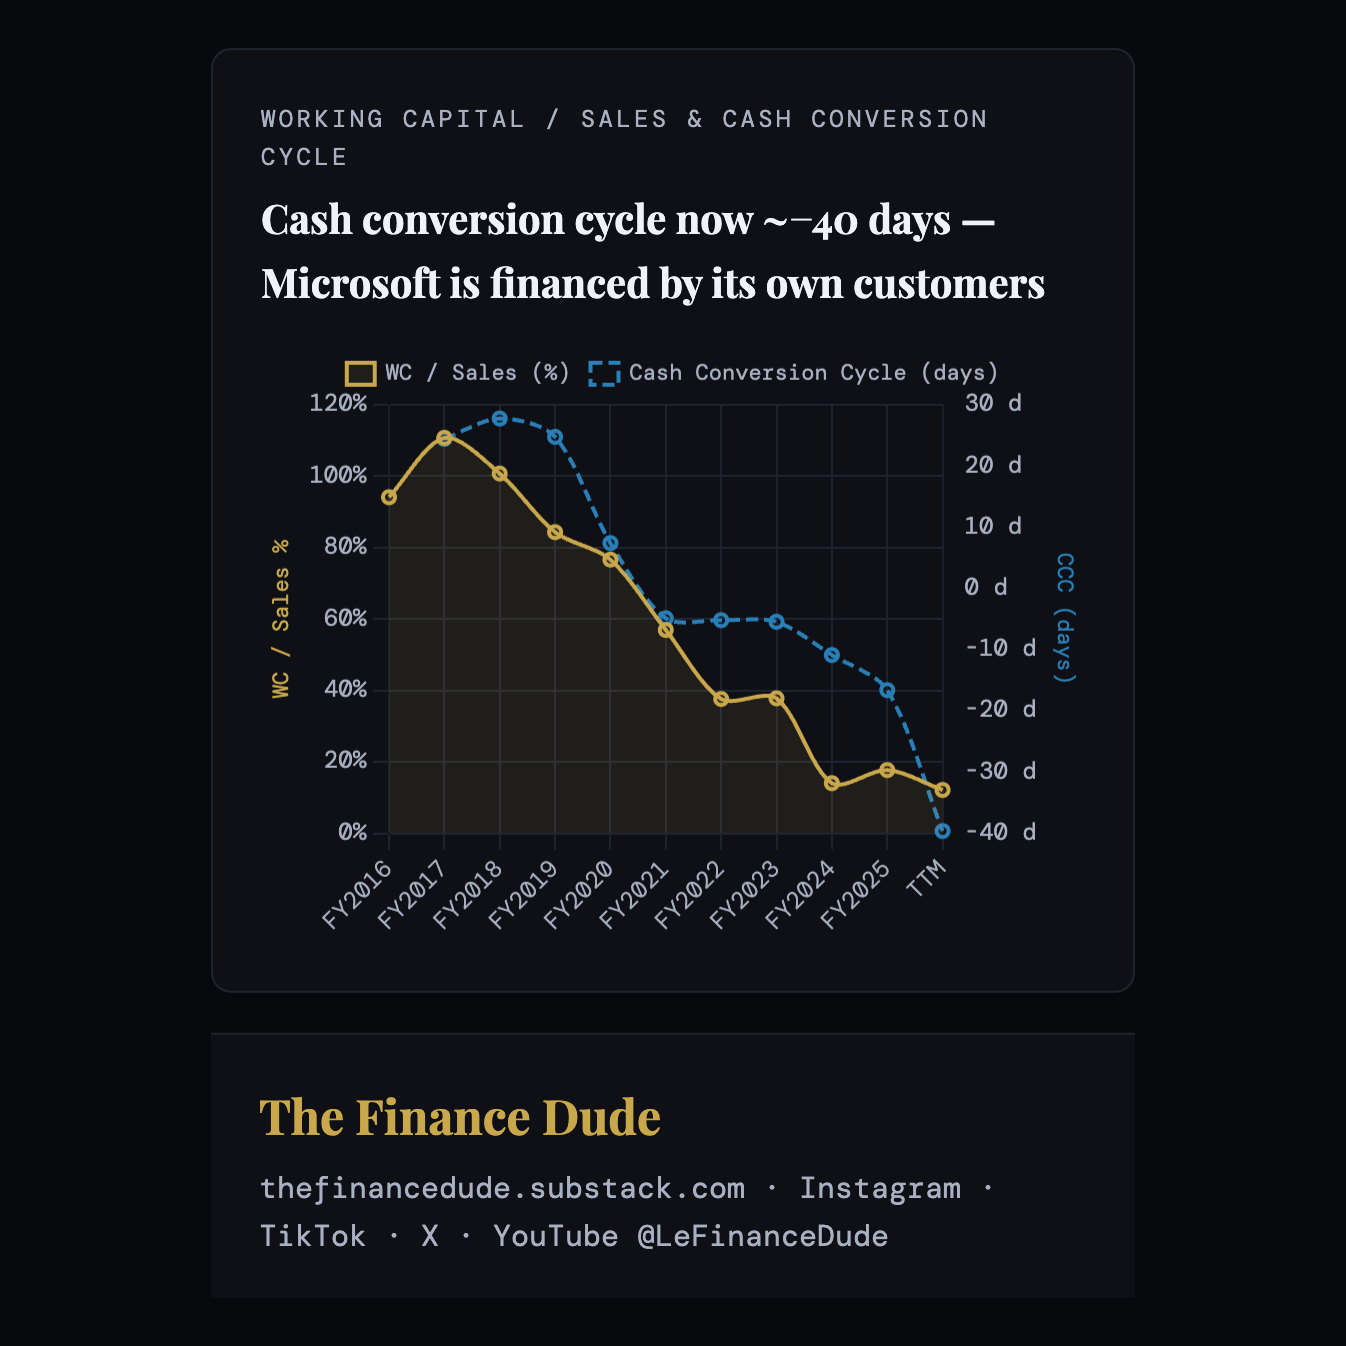
Working capital works in the company’s favor, and the trend has become more favorable over time. Because enterprises pay for subscriptions and cloud commitments in advance, often annually, Microsoft collects cash from customers before it pays its own suppliers — the business is financed in part by its own customers. The clearest measure is the cash conversion cycle, which has gone from about +25 days in FY2017 to roughly −40 days today: Microsoft now holds customers’ cash for nearly six weeks, on average, before its own bills come due.
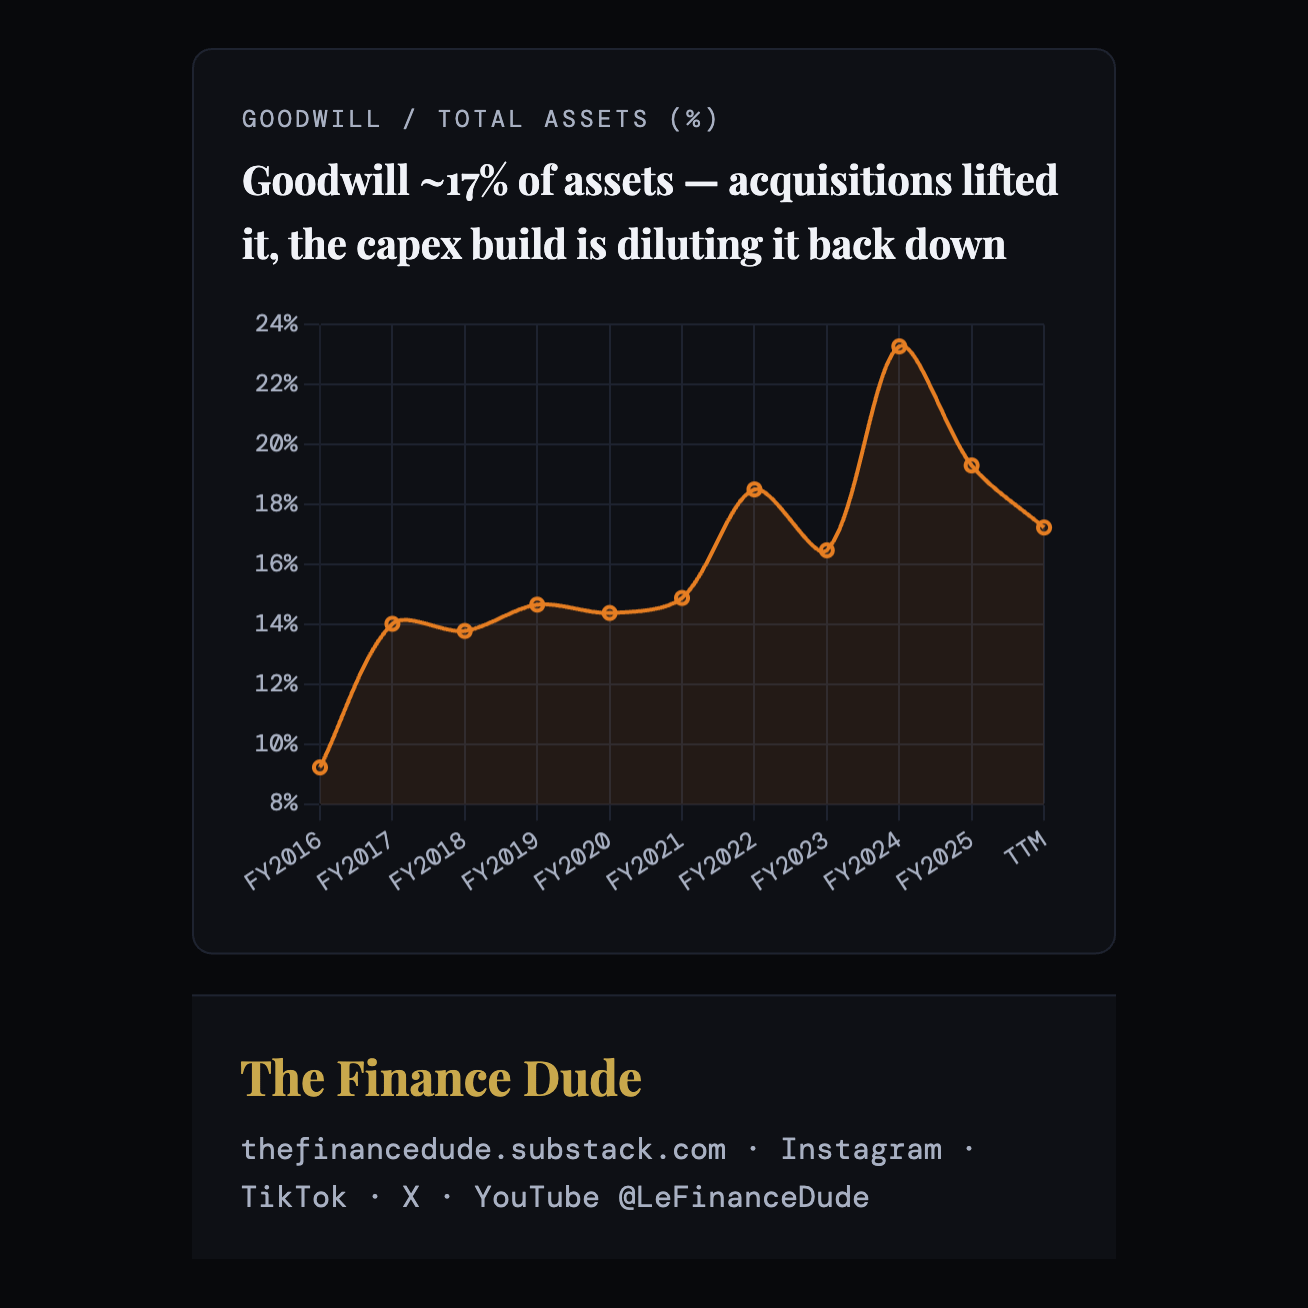
Goodwill is worth a glance for what it says about acquisition discipline. It sits at about 17% of total assets, having stepped up with each major deal — LinkedIn in FY2017, Nuance in FY2022, and Activision Blizzard in FY2024, which briefly pushed it above 23% of assets. It has since declined as the capital-expenditure build adds tangible assets (data centers and servers) faster than goodwill grows. More telling is what has not happened: despite more than $120 billion of acquisitions over the decade, Microsoft has taken no major goodwill impairment — a sign that the businesses it bought have largely earned their price rather than been written down.
Pillar 5 Score: 10/10 ✅✅✅
Net cash, AAA-rated, and able to self-fund a record capital cycle with $73B in yearly FCF to spare.
Pillar 6. Management Quality
Microsoft’s management has one of the strongest long-term value-creation records among large-cap companies.
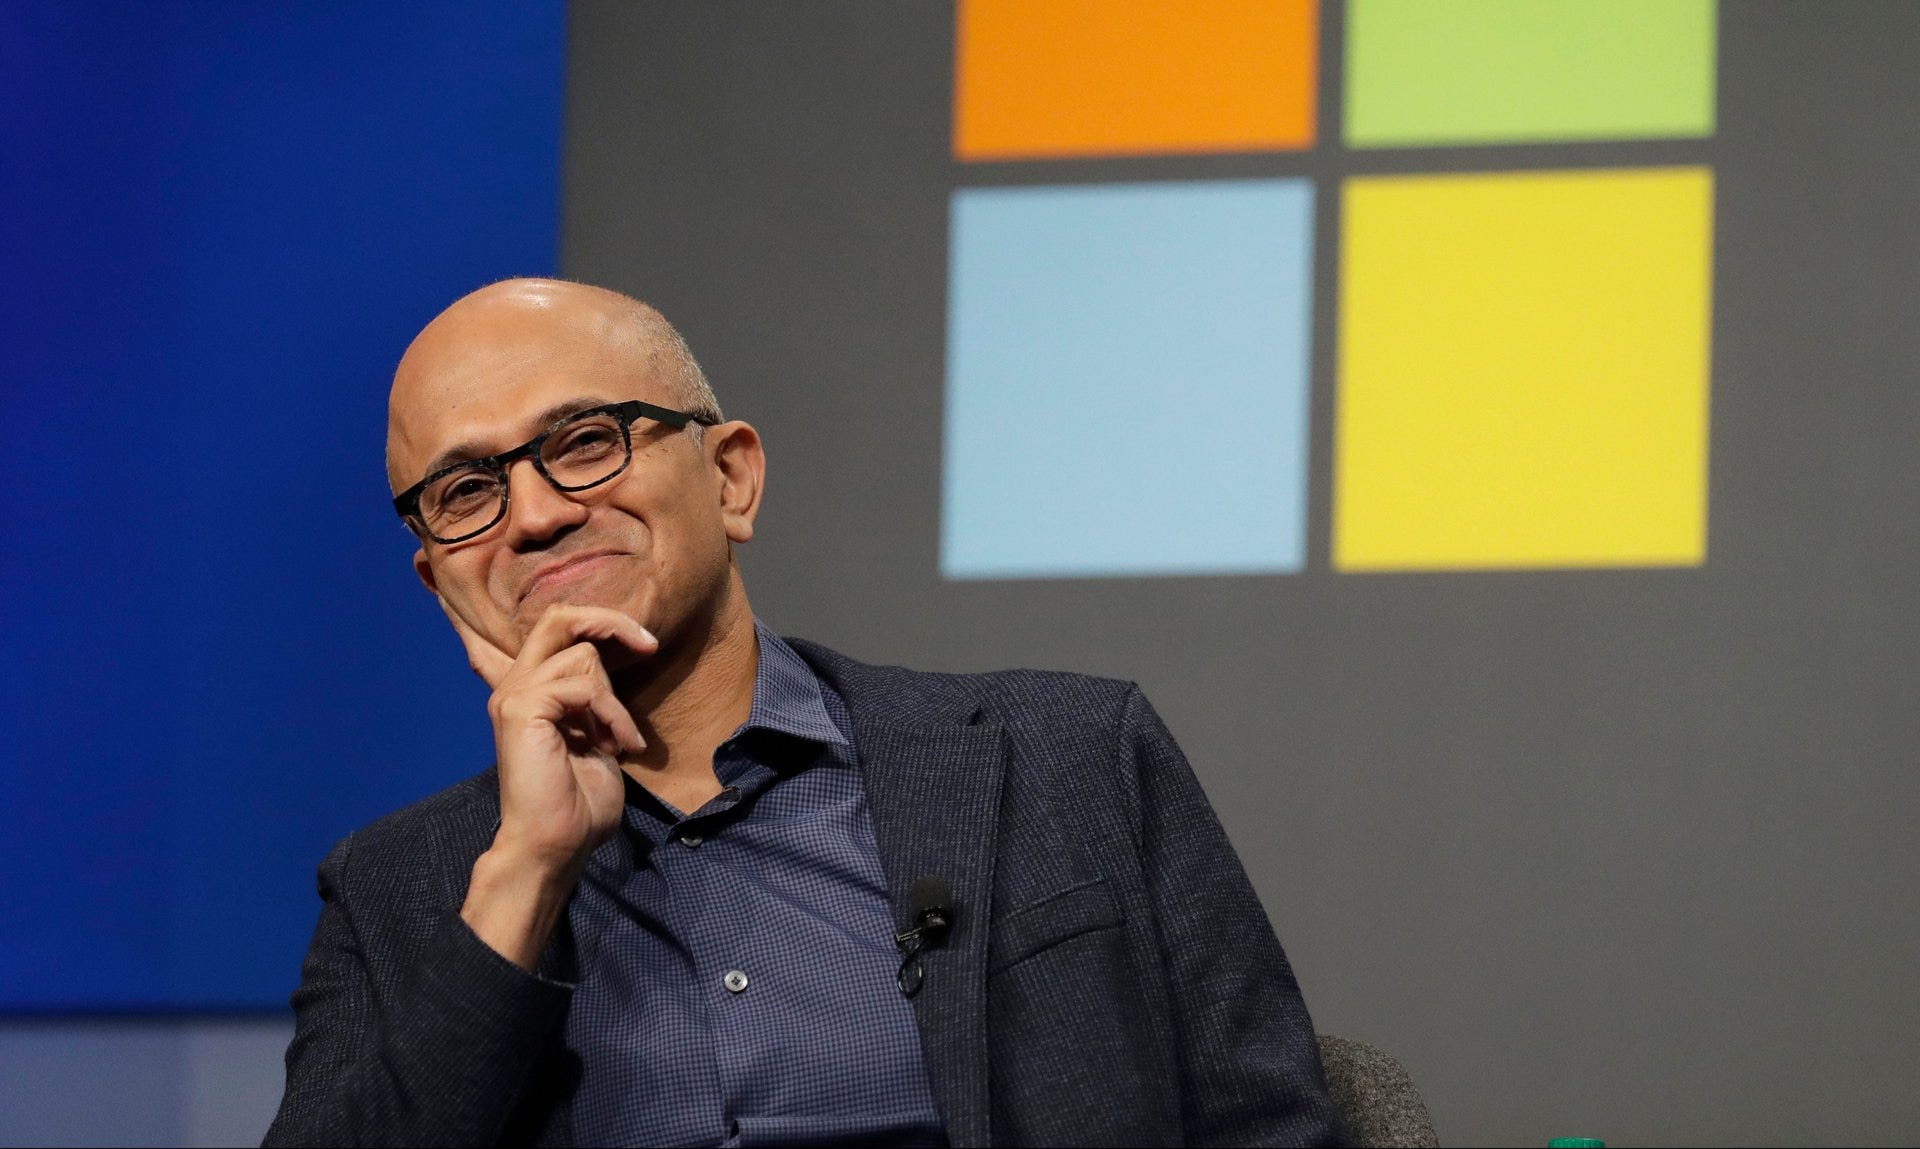
Satya Nadella was named CEO in February 2014, succeeding Steve Ballmer, and assumed the additional role of Chairman in June 2021 following the retirement of John W. Thompson. His leadership philosophy — articulated in his 2017 book *Hit Refresh* — centers on cultivating a “growth mindset” culture (influenced by psychologist Carol Dweck), genuine empathy, and the conviction that technology should empower every person and organization on the planet. Under his tenure, Microsoft’s market capitalization grew from approximately $300 billion to over $3 trillion, and the company has navigated the AI transition more adeptly than any peer of comparable scale. Nadella’s total compensation was approximately $79 million in FY2025, predominantly equity-based and aligned with long-term shareholder returns.
Pillar 6 Score: 10/10 ✅✅ ✅
A proven, aligned, and disciplined leadership team that 10x’ed Microsoft’s Market Cap in a decade. Not bad.
Pillar 7. Capital Allocation
Microsoft’s capital-allocation record is excellent, but the scale of the current investment introduces real, present-tense uncertainty into the return on that capital. Both things are true, and the pillar is essentially a question of whether a great allocator is making its biggest bet at the right time.
Start with the record, which is strong on every conventional measure.
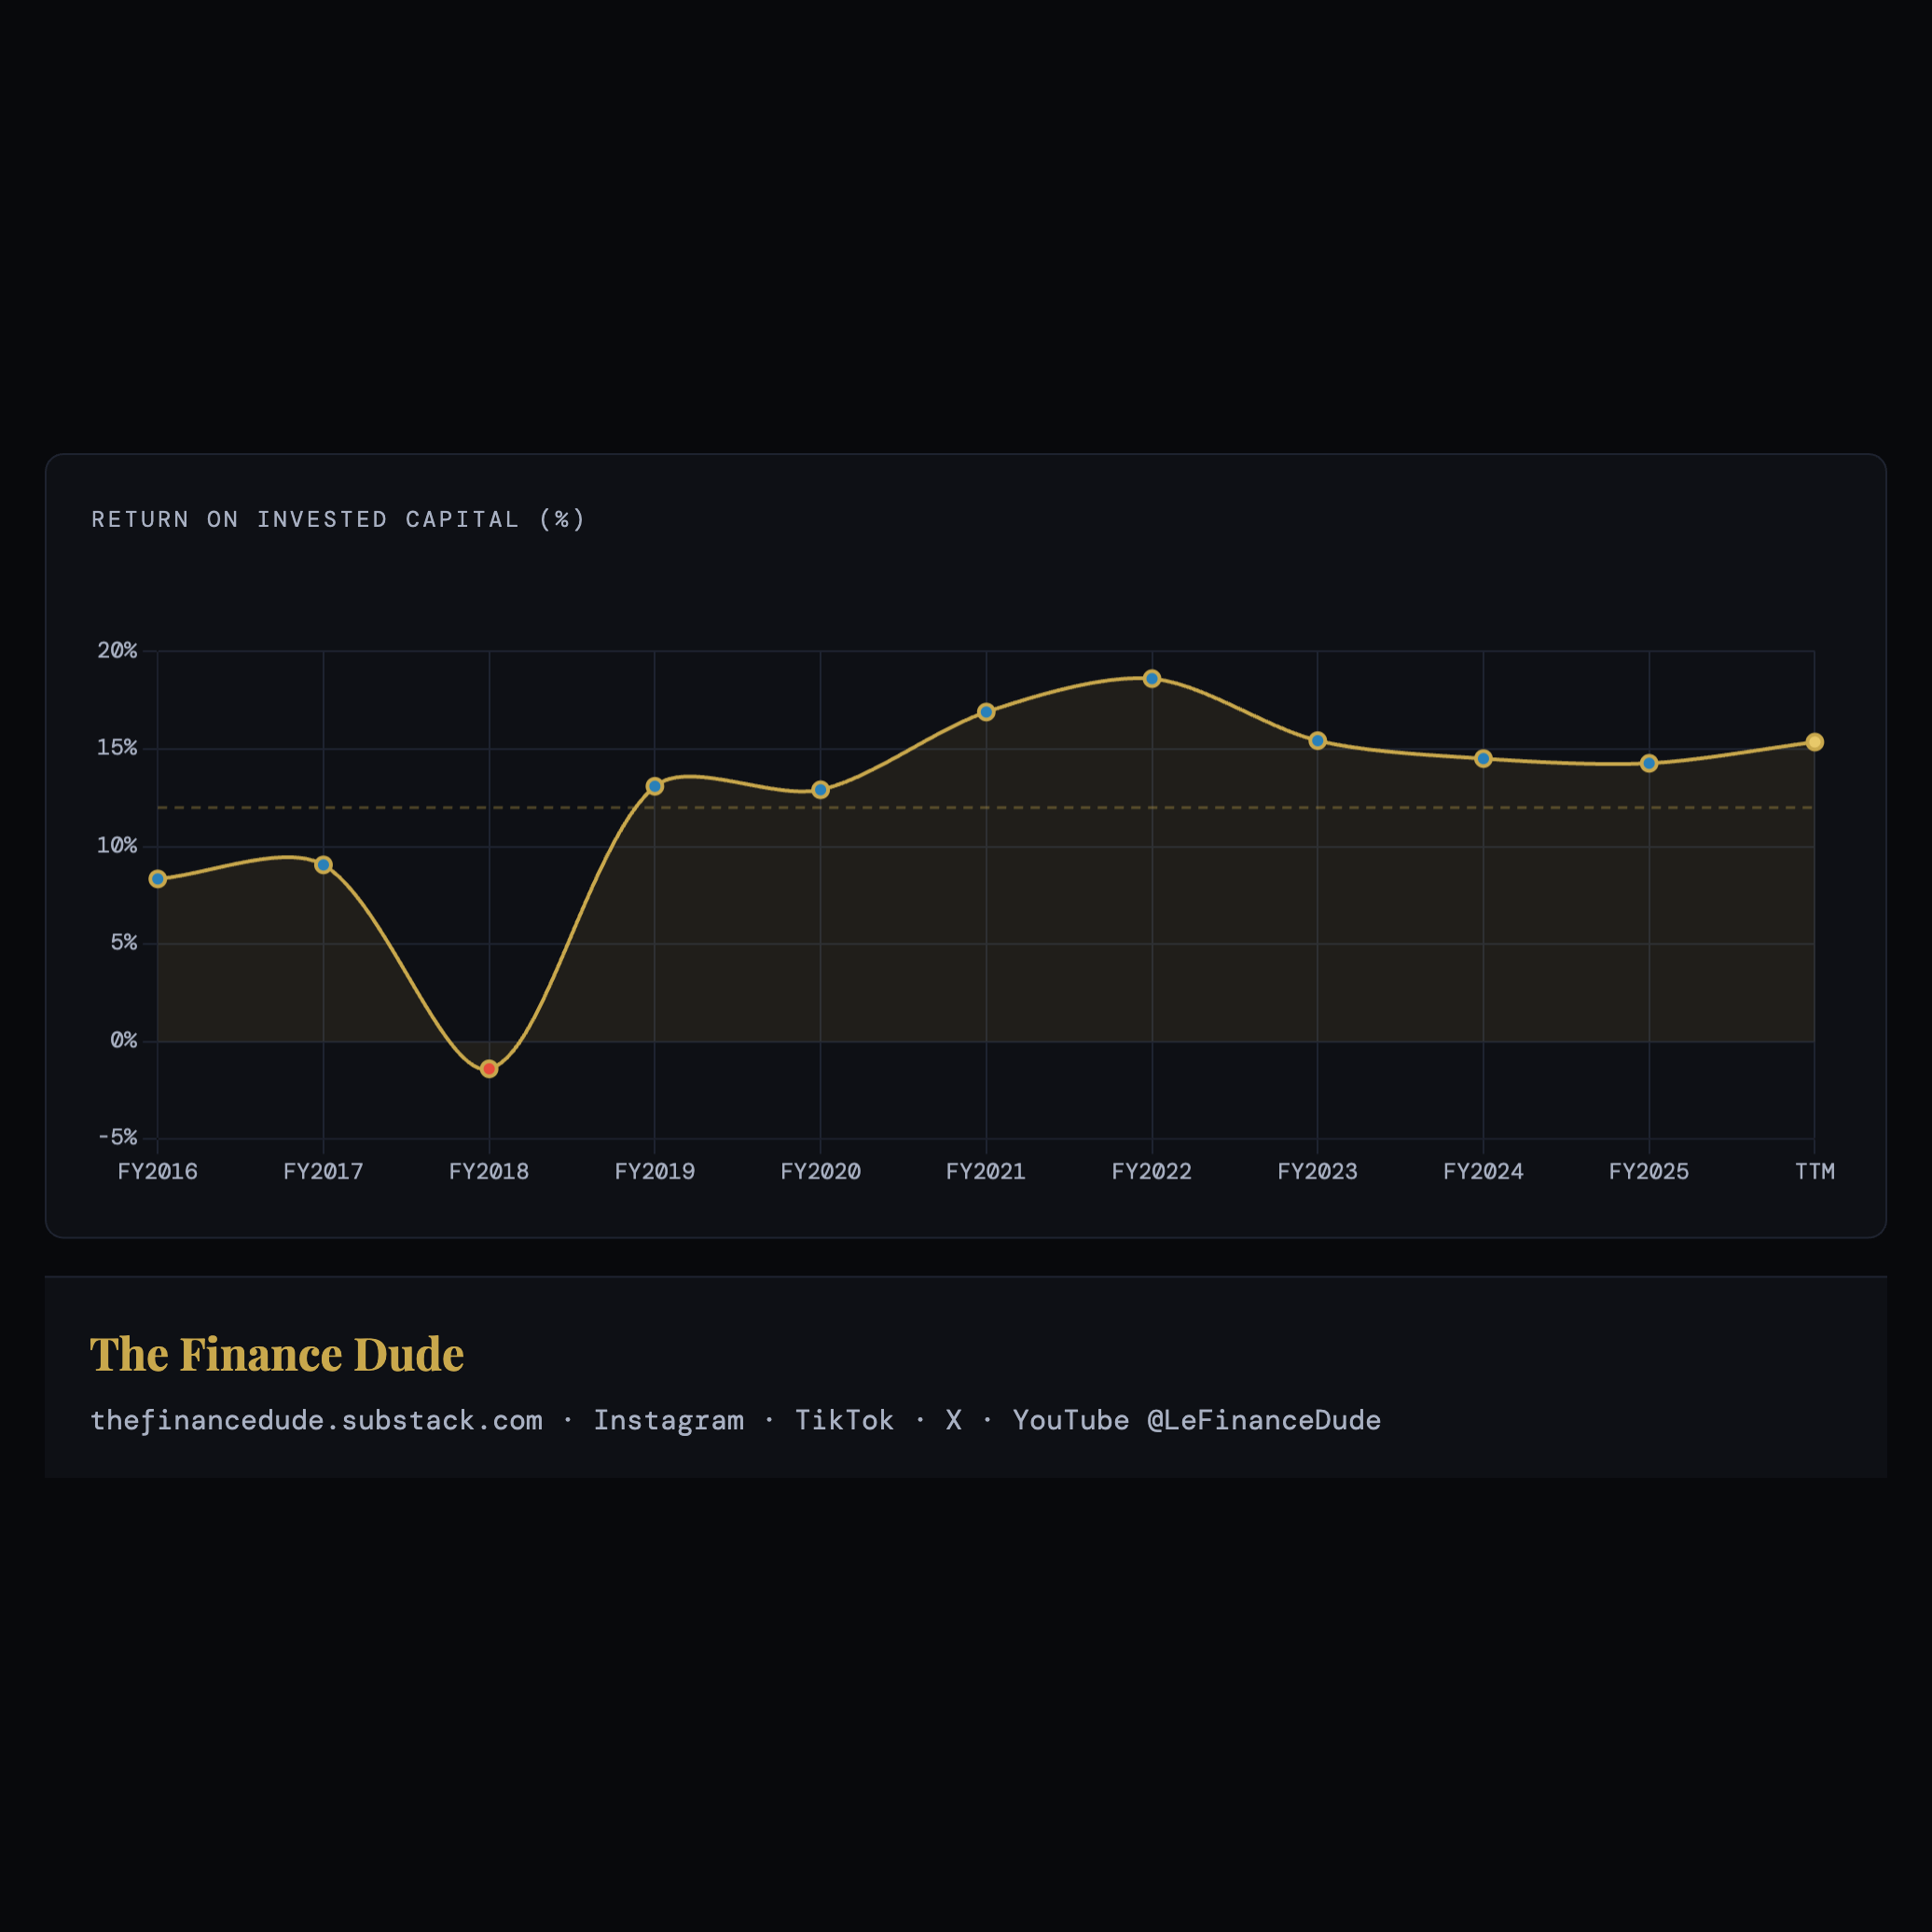
Return on invested capital is about 15.4%, and it is holding on there right through the cloud build-out.
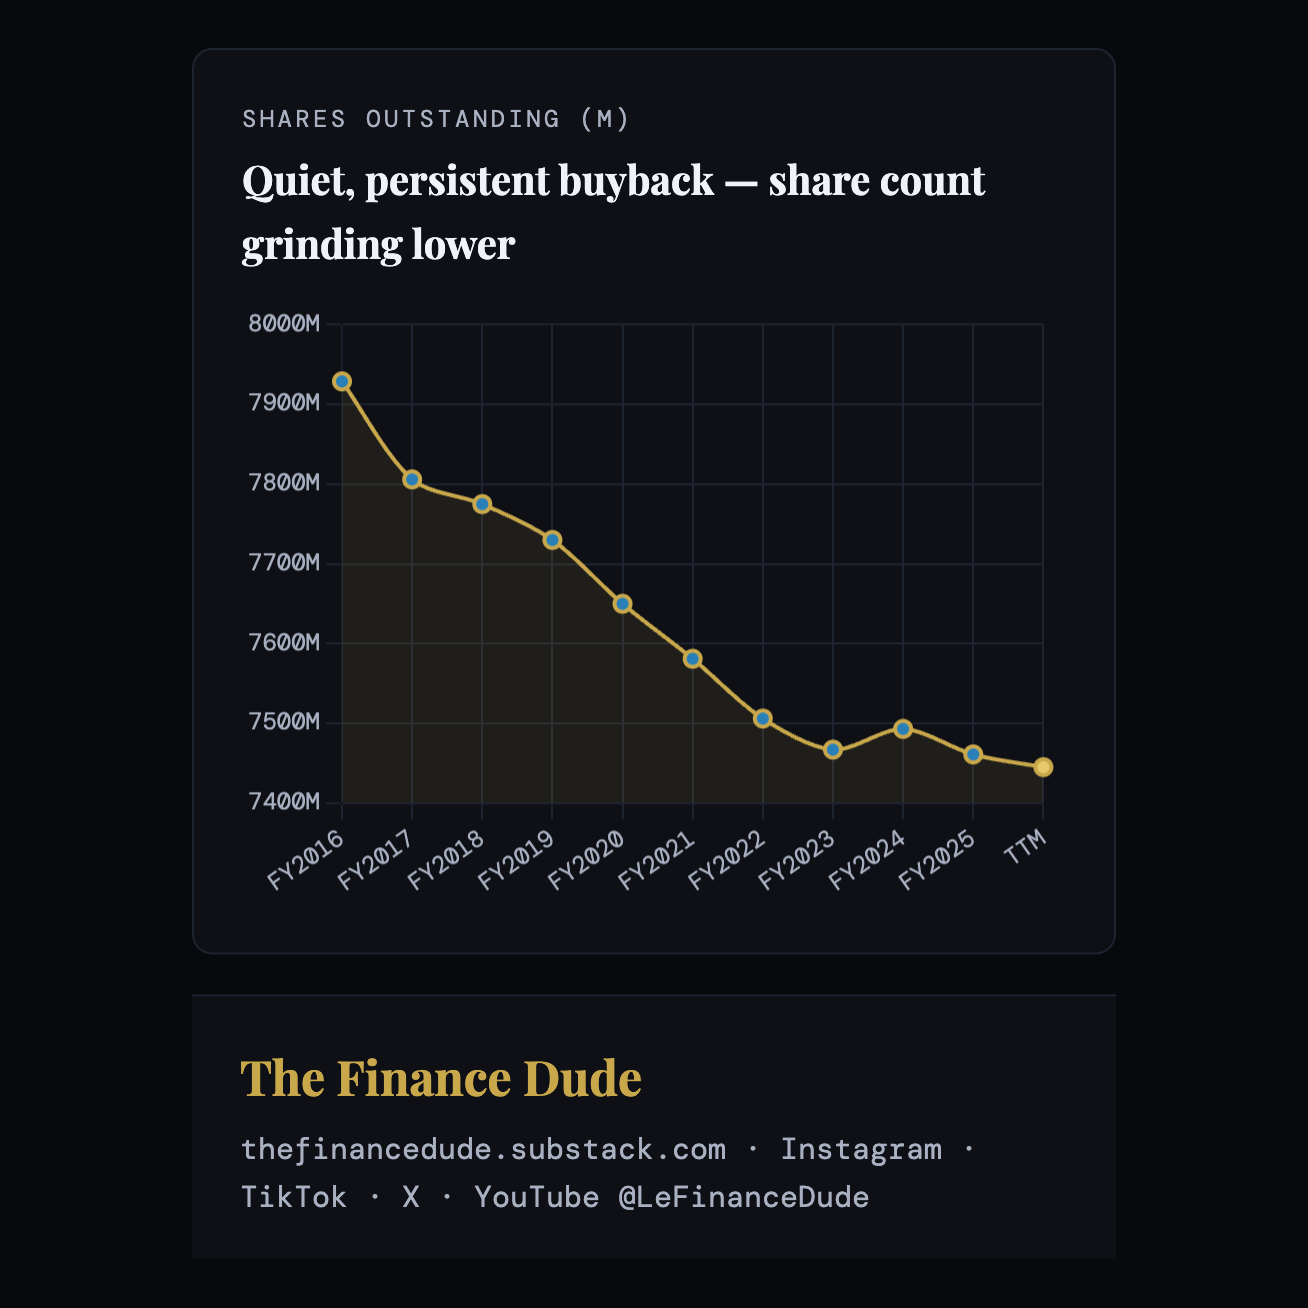
Returns to shareholders are equally disciplined. The share count has ground steadily lower — from about 7.93 billion shares in FY2016 to roughly 7.44 billion today — so buybacks are doing more than masking dilution from stock-based compensation; they are shrinking the base.
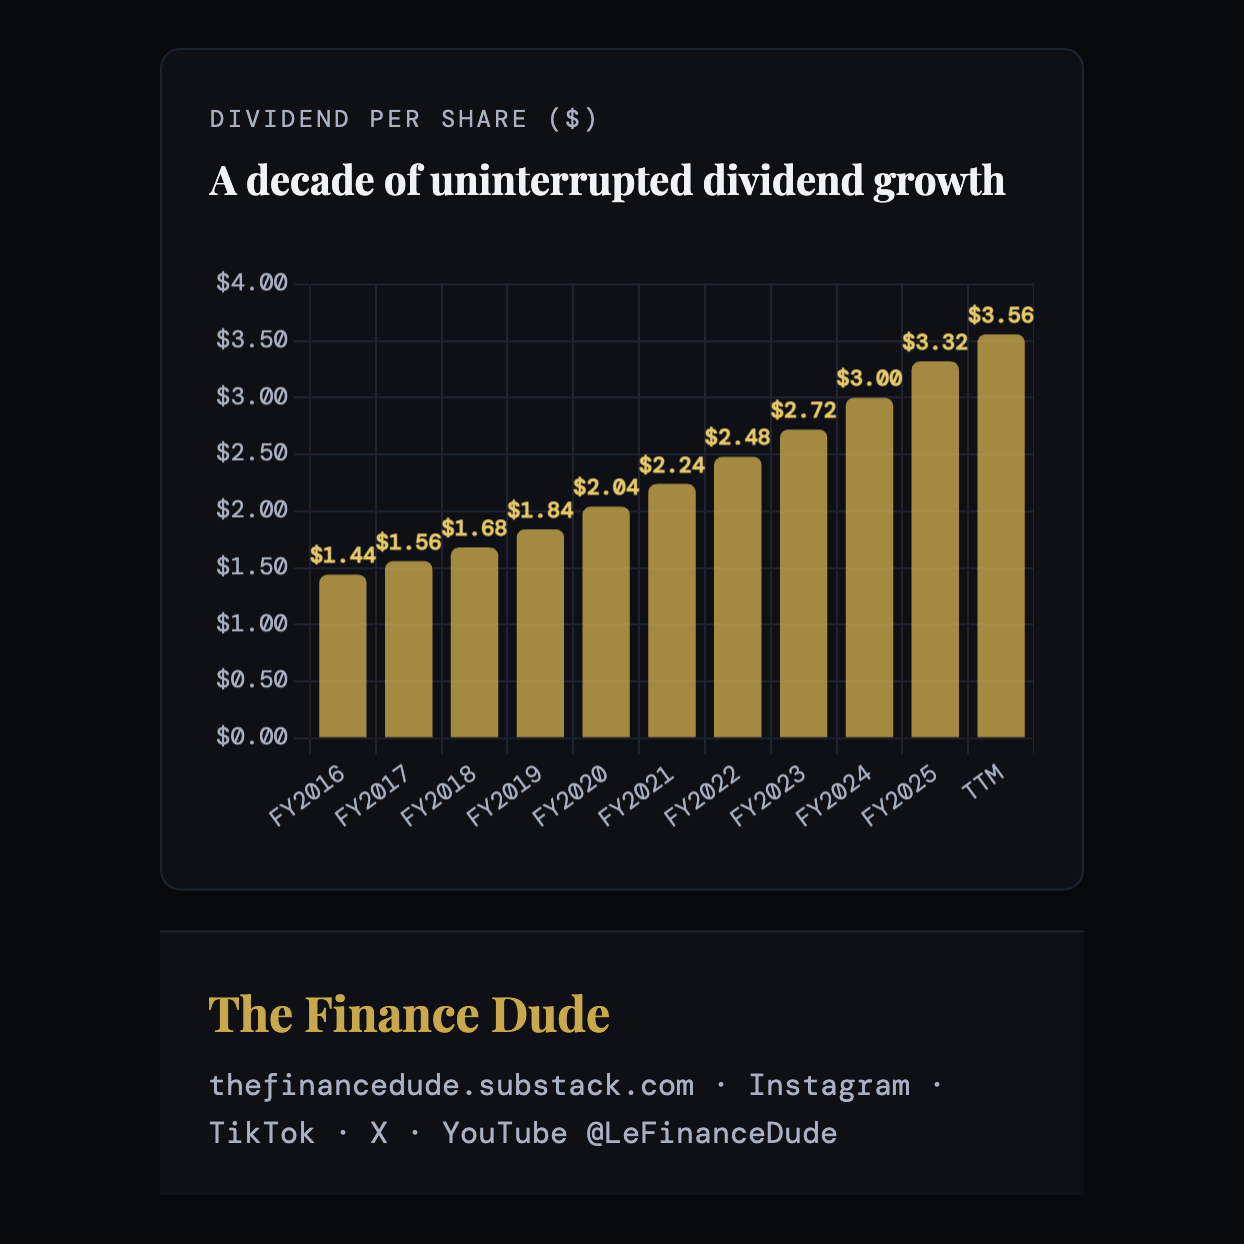
Alongside it, the dividend has risen from $1.44 to $3.56 per share over the last decade, at a conservative payout ratio of around 25%, which leaves ample room to keep raising it. In total, Microsoft returned about $11.4 billion to shareholders in the most recent quarter.
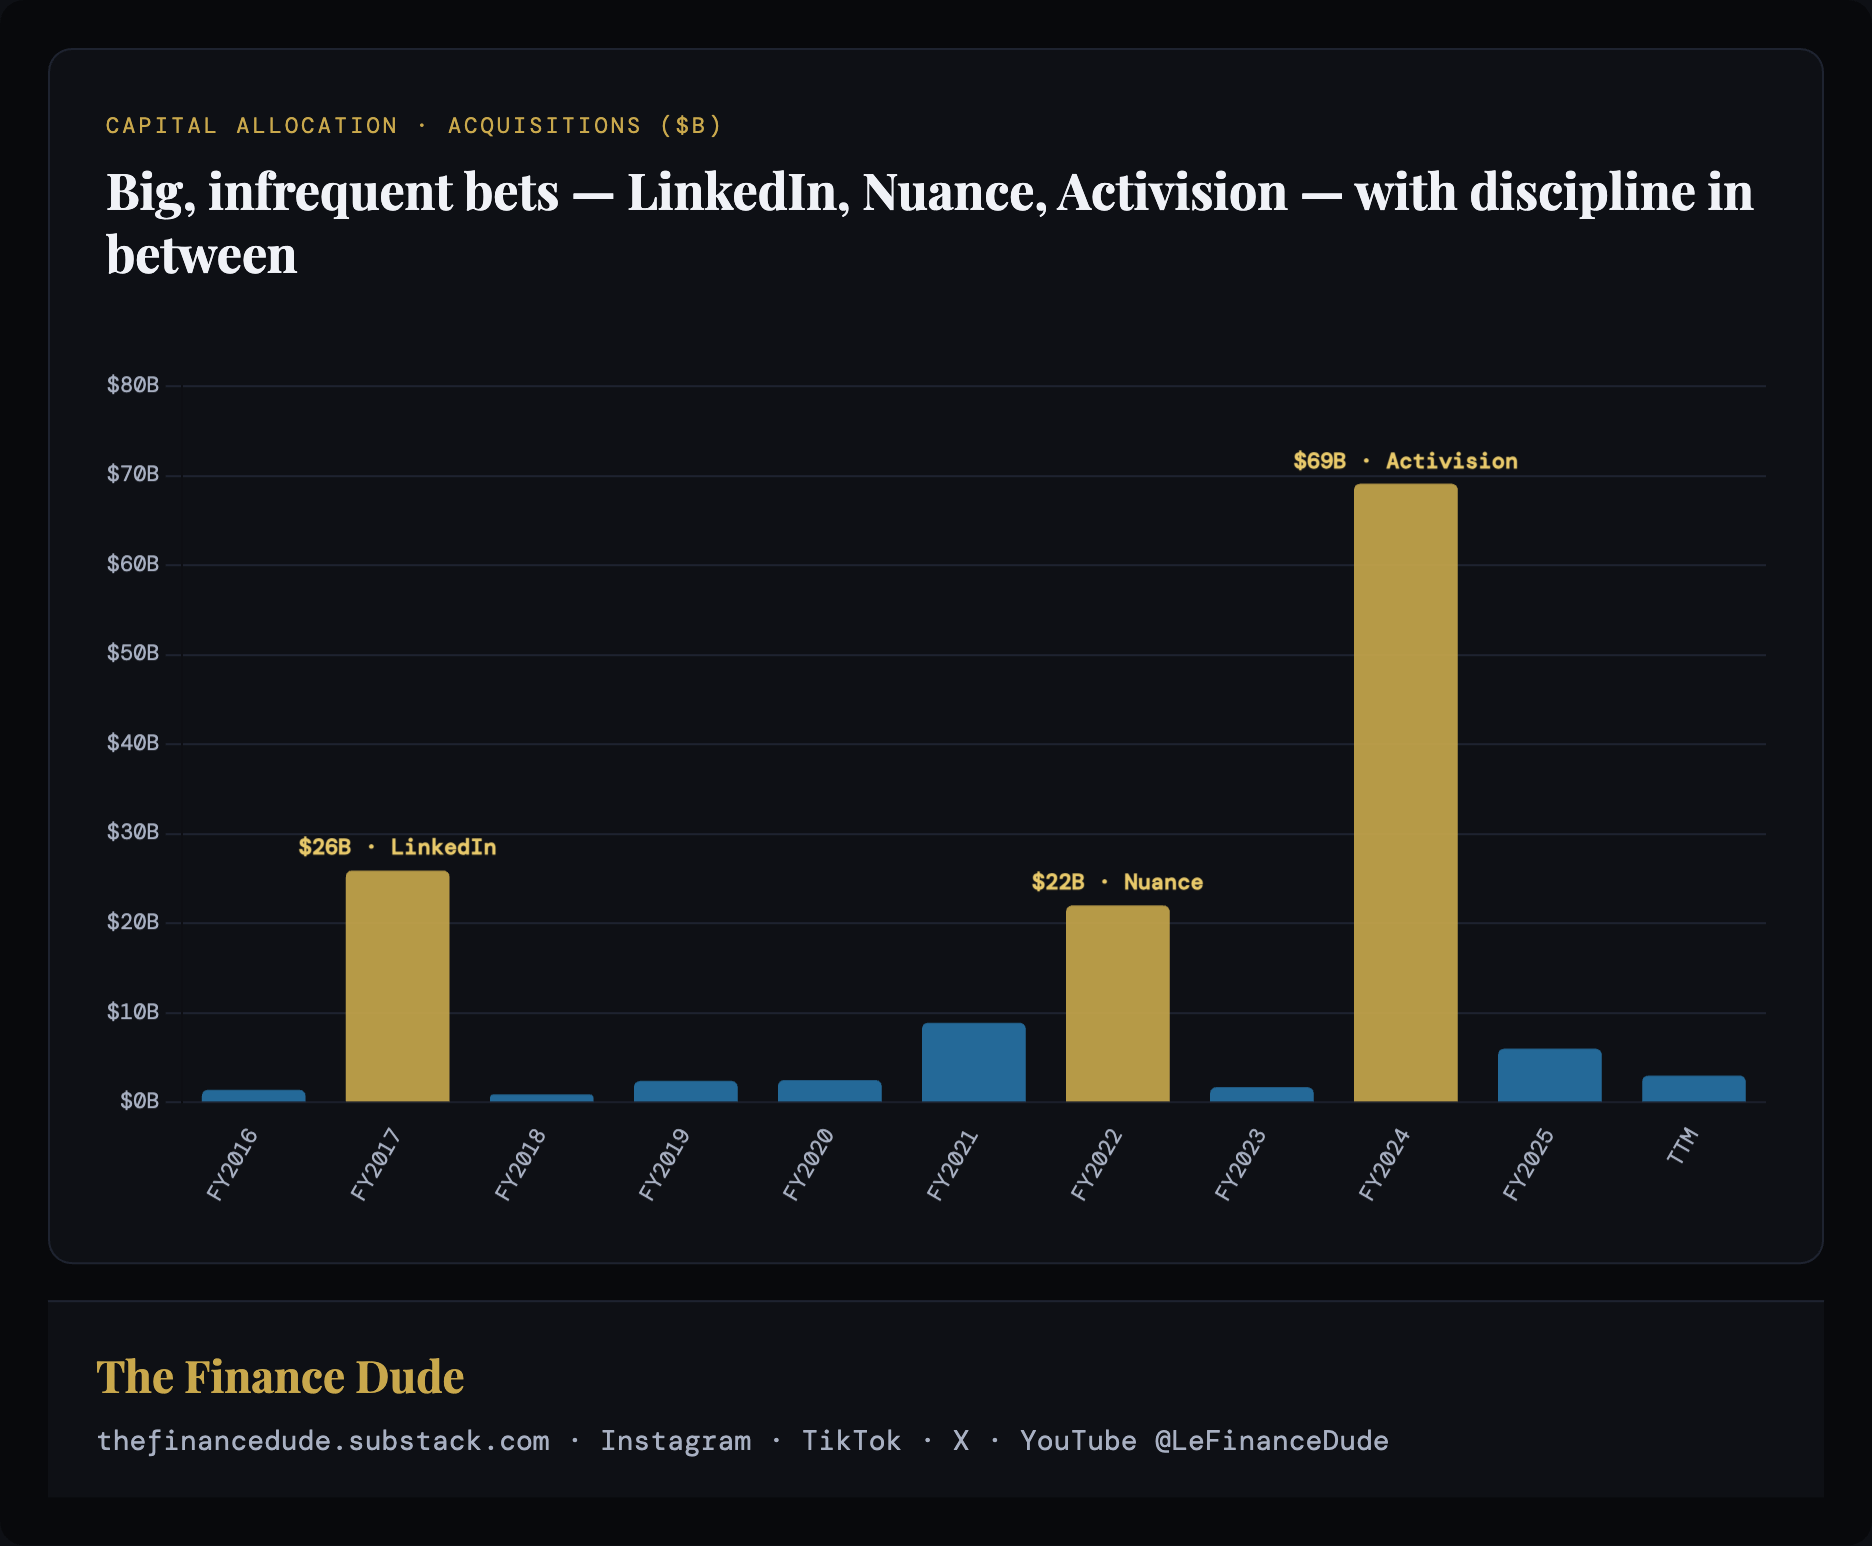
Acquisitions have been large but infrequent — the mark of a disciplined buyer, not a serial acquirer. Most years are small bolt-ons; the record is defined by three signature deals: LinkedIn (~$26 billion, FY2017), Nuance (~$22 billion, FY2022), and Activision Blizzard (~$69 billion, FY2024). Across the full decade Microsoft has spent roughly $144 billion on acquisitions, yet has taken no major goodwill impairment (as we’ve seen in Pillar 5) — a sign the businesses it bought have largely earned their price. The quality shows in the outcomes: LinkedIn alone has grown into a $16 billion-plus revenue business and a proprietary professional-data network that now feeds Copilot. The open question is Activision — by far the largest and most recent, its return is still less proven than the others.
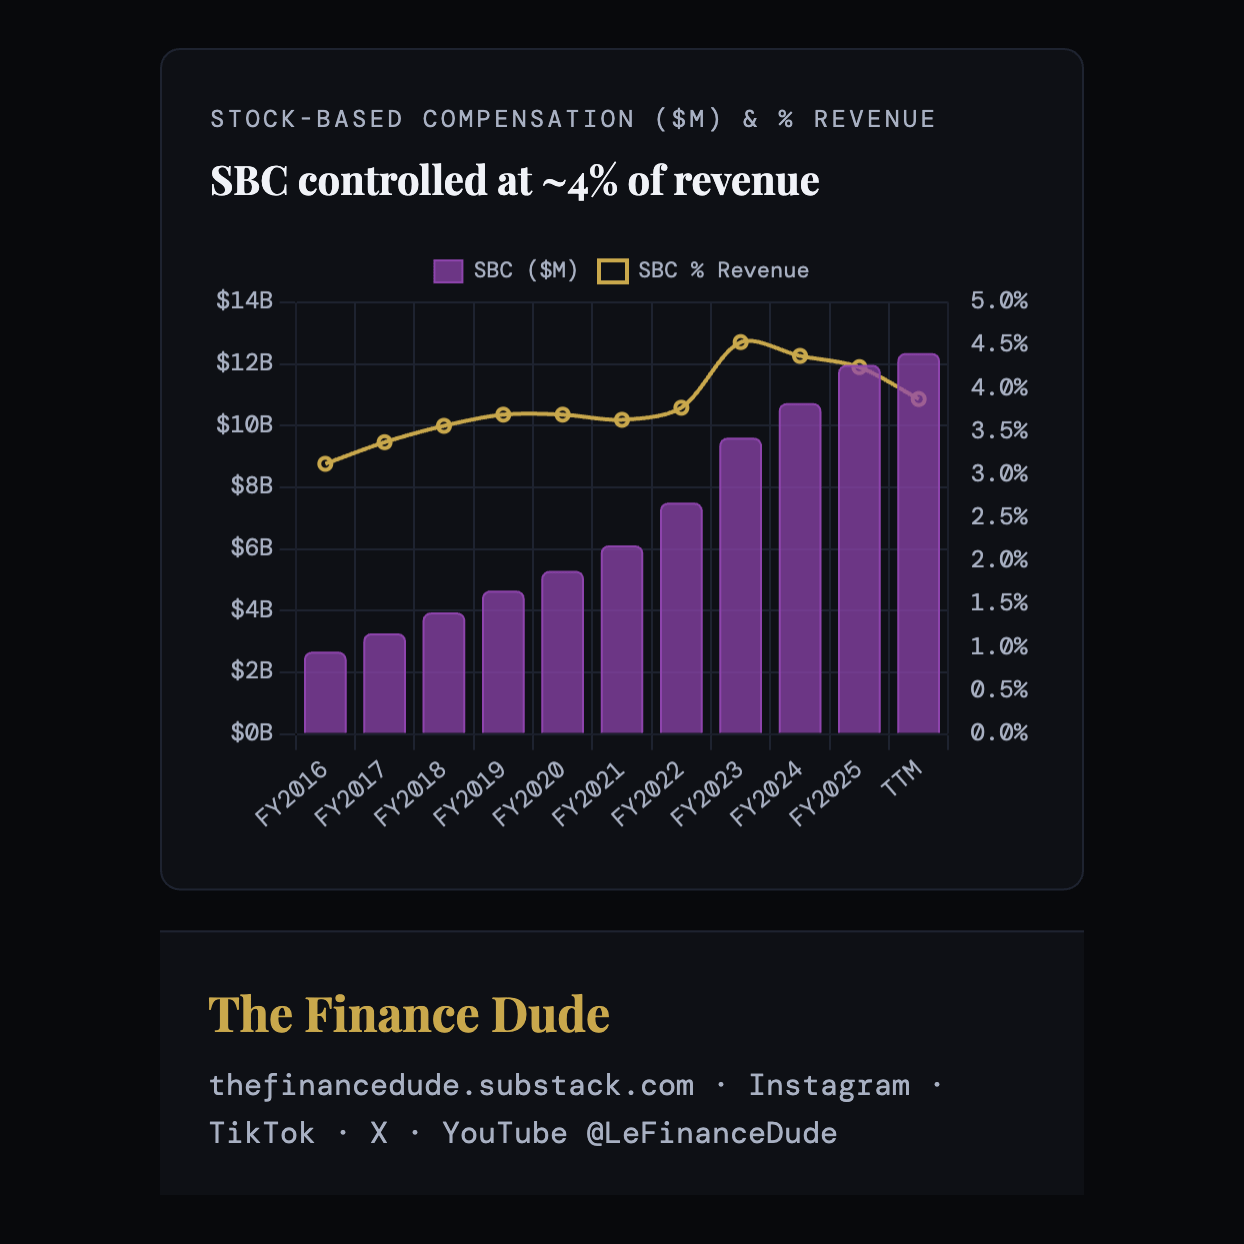
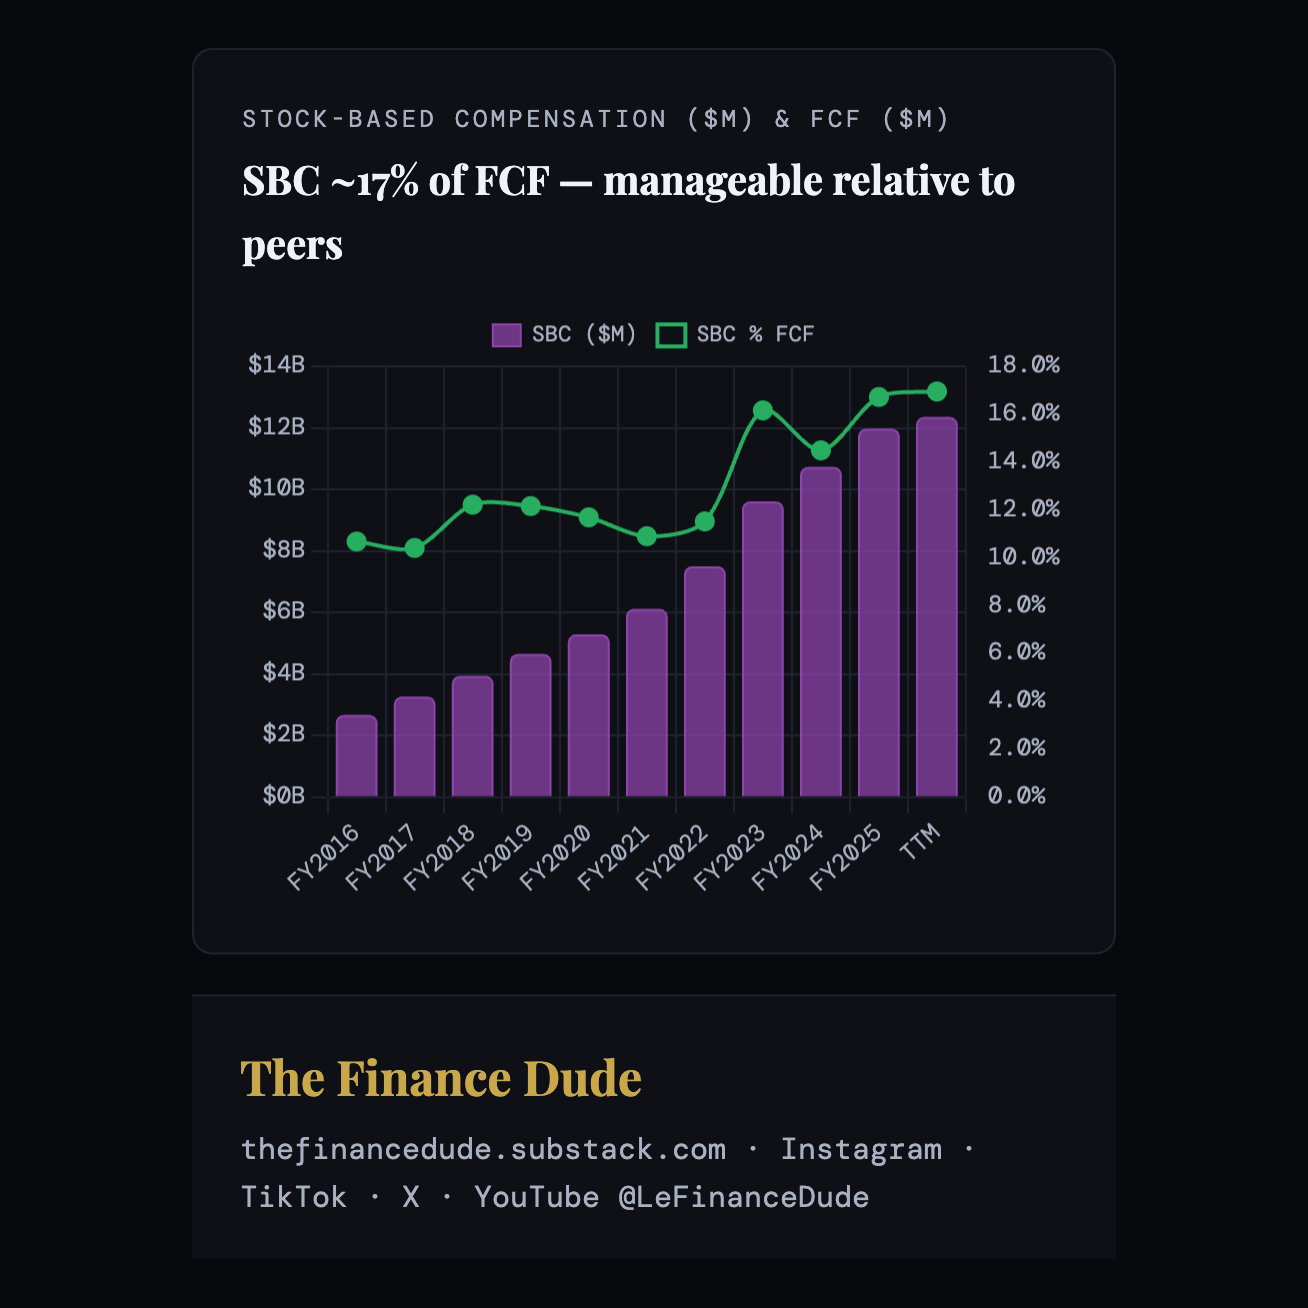
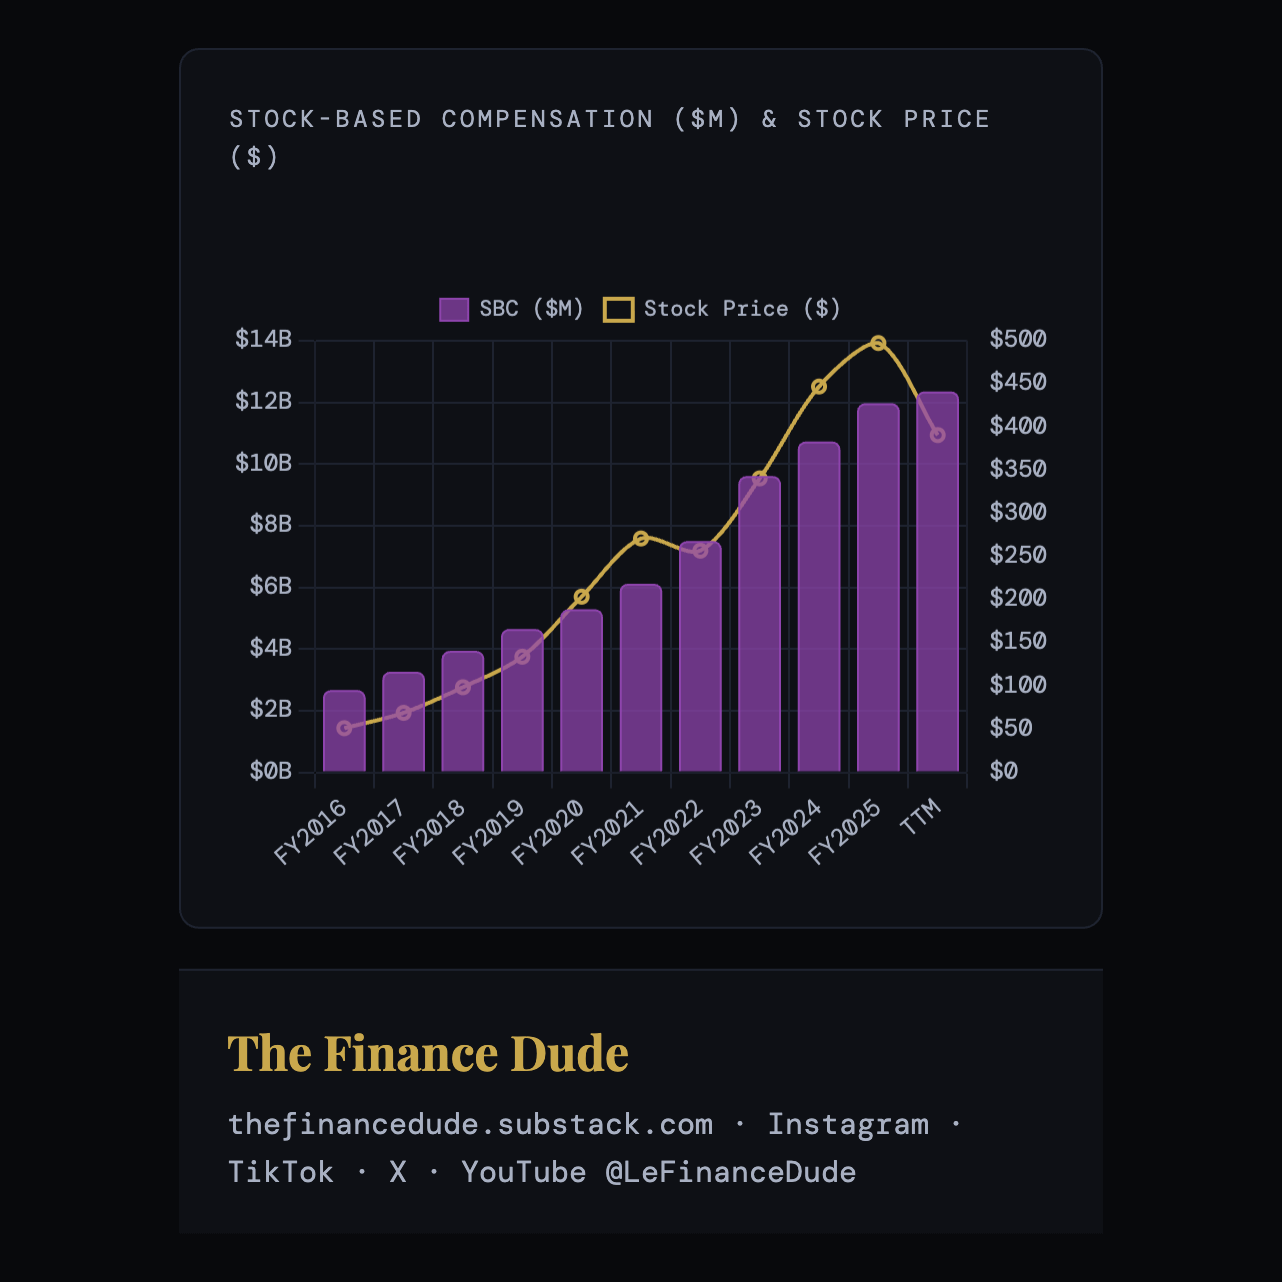
Compensation is well controlled, which is rarer than it sounds in large-cap technology. Stock-based compensation runs at about 3.9% of revenue and roughly 17% of free cash flow — both low for the sector, where peers frequently run double or more those levels — and the figure has stayed in a narrow band even as headcount and pay competition rose.
The concern is capital intensity, and it is a present one. Capital expenditure has gone from 9.8% of sales to over 30% in a couple of years, and now absorbs roughly 57% of operating cash flow.
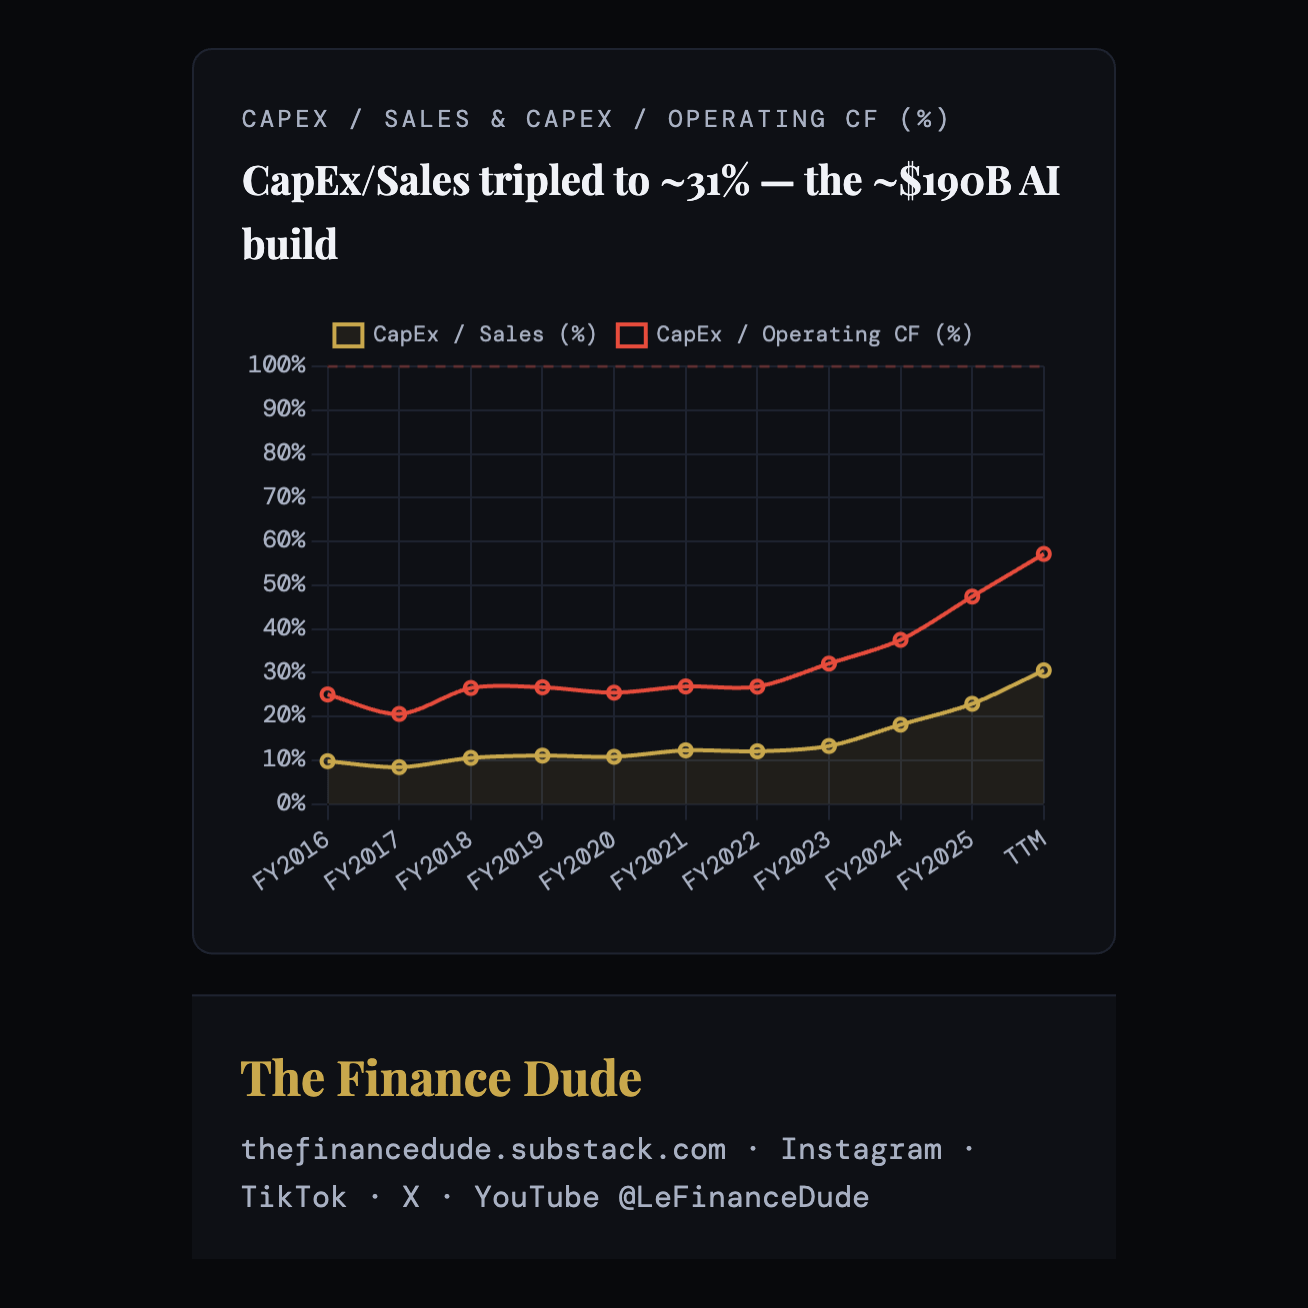
The roughly $190 billion planned for the current calendar year is the largest commitment in the company’s history. The mechanical effect is unavoidable: deploying that much capital into assets that have not yet produced revenue lowers return on invested capital in the near term, before any eventual recovery — so the very metric that anchors this pillar is set to compress over the next few years. The investment may well prove correct, and the $627 billion backlog we saw in Pillar 1 is the strongest argument that it will. But a backlog is contracted demand, not realized return, and capital allocation is ultimately judged on results rather than intentions.
Pillar 7 Score: 7/10 ⚖️
An excellent long-run record on returns, buybacks, dividends, and compensation discipline, marked down because record capital intensity and an as-yet-unproven return on the largest investment in the company’s history are a genuine, present-tense risk. The score should rise as the AI capital earns its keep, or fall if it does not.
Pillar 8. Outlook & Growth Drivers
Microsoft’s growth outlook is exceptional and unusually well-evidenced — it rests on signed contracts and live products rather than projected market size. The relevant measure is penetration, not total addressable market, and Microsoft is early in every major driver.
The AI business introduced in Pillar 1 — a $37 billion run rate growing 123% — is the largest single driver, and it remains small relative to the opportunity it addresses.
Azure, growing about 40%, is constrained by Microsoft’s own capacity rather than by demand; management expects it to hold around these elevated levels in the near term as new data centers come online.
Copilot adoption is still early: paid enterprise seats have reached 20 million (up ~160% year-over-year), but against an estimated 400 million commercial Microsoft 365 seats that is only about 5% penetration on the $30-per-seat product — the clearest measure of how much monetization runway is left. The opportunity is large, but worth sizing honestly. Not all 400 million seats are eligible. Microsoft doesn’t disclose Copilot’s revenue or its realized price, but the per-seat figure it actually collects is below the $30 list once enterprise volume discounts are applied. On reasonable assumptions — Copilot reaching the mid-teens-to-20% of the commercial base over the next several years — it becomes a multi-billion-dollar annual revenue line in its own right.
But a Copilot seat doesn't carry the near-free margin of a classic Office upsell. Each prompt runs a live AI inference with real compute cost — the same "cost of compute" that pulled Microsoft Cloud's gross margin from 73% to 66% (Pillars 1 and 4) — so Copilot lifts revenue and the cost of serving it together. It's highly profitable in absolute dollars, but its margin only improves as inference costs fall (helped by Maia silicon) and the capex amortizes across a far larger seat base.
But the most consequential driver is a structural change in pricing. Microsoft is moving its products from per-seat pricing, which is capped by a customer’s headcount, to per-seat pricing plus consumption. GitHub Copilot has already shifted to usage-based billing. It adds a second, uncapped revenue meter on top of the per-seat one. Supporting drivers compound alongside — security revenue above $20 billion, Fabric up 60%, Dynamics up 22%.
Management’s formal guidance is for double-digit revenue and operating-income growth to continue into fiscal 2027. The single question this pillar cannot answer is whether the market has already priced this growth in, which is the subject of Pillar 10. Just stay tuned.
Pillar 8 Score: 10/10 ✅✅✅
A deep, multi-source, evidence-backed growth runway with low penetration and demonstrated pricing power.
Pillar 9. Risks
Microsoft is financially resilient, but its principal risks are serious, specific, and concentrated around the same AI investment that drives its growth — which is the reason this pillar does not score higher.
Ranked by magnitude and probability, they fall into three tiers.
The largest risk is that the capital-spending bet does not earn its return. If AI demand moderates, roughly two-thirds of the ~$190 billion in annual spending is fast-depreciating hardware exposed to write-downs, while cloud gross margins are already compressing — from about 73% to 66%. This is not hypothetical — it is the concern currently reflected in the share price, which sits roughly 30% below its 2025 high.
Dependence on OpenAI: Microsoft’s AI position relies substantially on a partner whose situation has grown complex — corporate restructuring, its own infrastructure plans, a pending IPO, and reported tension over exclusivity. Microsoft is mitigating this by developing its own models and offering competing ones on Foundry, but a deterioration would weaken its AI positioning.
Regulatory. It is active and specific: the U.S. Federal Trade Commission has an open investigation into Azure licensing, Copilot bundling, and the OpenAI relationship; in the EU, Microsoft settled the Teams bundling case in September 2025 with seven-year commitments, but the European Commission opened new cloud “gatekeeper” investigations under the Digital Markets Act in November 2025. Remedies could constrain the bundling that supports the moat.
A second tier of operational risks is narrower but real.
Copilot monetization could ramp slower than consensus now embeds: at $30 per seat it is the largest pricing action in Microsoft 365’s history, and some enterprises have been slow to adopt on ROI skepticism and change-management friction — a soft ramp would disappoint estimates that already price in a meaningful Copilot contribution.
Azure’s growth depends on delivering capacity on time; power availability, permitting, construction, and GPU supply are all gating factors, and a stumble could cede AI workloads to rivals.
The Activision integration — the largest deal in company history — adds execution risk, though it is not thesis-defining.
The third tier is financial and macro.
Operating in 190-plus countries exposes Microsoft to tightening data-sovereignty rules, with China a uniquely elevated case given U.S.–China technology tensions.
While cloud spending has proven resilient, the consumption-based portion of Azure — not contractually committed — is the line most exposed to a severe enterprise-IT downturn.
On resilience:
The net-cash balance sheet and the contracted, recurring revenue base mean a downturn would dent rather than threaten the business.
No single customer accounts for more than 10% of revenue, so there is no client concentration to compound a shock.
Pillar 9 Score: 8/10 ✅
A resilient company whose risks are nonetheless serious, specific, and unusually correlated around a single bet. The balance sheet prevents anything lower.
Pillar 10. Valuation
Now into valuation. I’ll run a Multiple Valuation and a DCF to assess Microsoft’s fair value. But —
Only paid subscribers get access to every report and the analytical tools.
Don’t Miss Out: Unlock Full Access to The Finance Dude Research for LESS THAN 22 CENTS a Day
Multiple Valuation
I value Microsoft by breaking it into its three segments, projecting each forward five years revenue under a bear and a bull case, and applying a revenue multiple set by the quality and growth of that specific stream. Summing the parts is cleaner than stamping one blended multiple on the whole company — because a dollar of Intelligent Cloud, growing 30%-plus with Azure at its core, is worth far more than a dollar of More Personal Computing, where Windows and gaming grow at a fraction of that pace. A single company-wide multiple would tax the fast-growing dollars and flatter the slow ones; valuing each segment on its own merits avoids both.
