
Tesla Is Soaring Again — But the Numbers Tell a Very Different Story
A deep dive into Tesla’s collapsing growth and margins, sky-high multiples, and the AI moonshot it desperately needs to deliver.

Hi Dude ✌️
Welcome to this free Analysis 1.0 — and today it’s all about Tesla! 🆓
But before we dive into the world’s most polarizing stock…
In case you missed it:
Why McDonald's is Poised for Continued Success: Leveraging AI and Tech for Future Growth
Inside Amazon's Success: Past Achievements and Future Strategies
Apple Intelligence: What the Market’s Betting on—and Why It Might Be Wrong
If you’re not already subscribed, you’re missing out on:
📅 Daily Macro + Earnings Updates
🗓️ Weekly Recaps of Key Financial Events
📊 Full Stock Analyses (1.0 + 2.0 format)
✅ Top-5 Monthly Best Buys
📈 Watchlist + Portfolio Access
⏰ Buy/Sell Alerts
🧮 Valuation Models to Download & Edit
🎓 Finance Education Series
Tesla Analysis 1.0
Now let’s see what’s really behind Tesla’s recent stock surge…
📍Ticker: $TSLA
📈Current Price: $347.68
⚖️ 52-Week Lo-Hi: $167.41 - $488.54
💼Sector: Consumer Discretionary
💰Market Cap: $1.12 Trillion
🗓️Latest Financials: Q1 2025
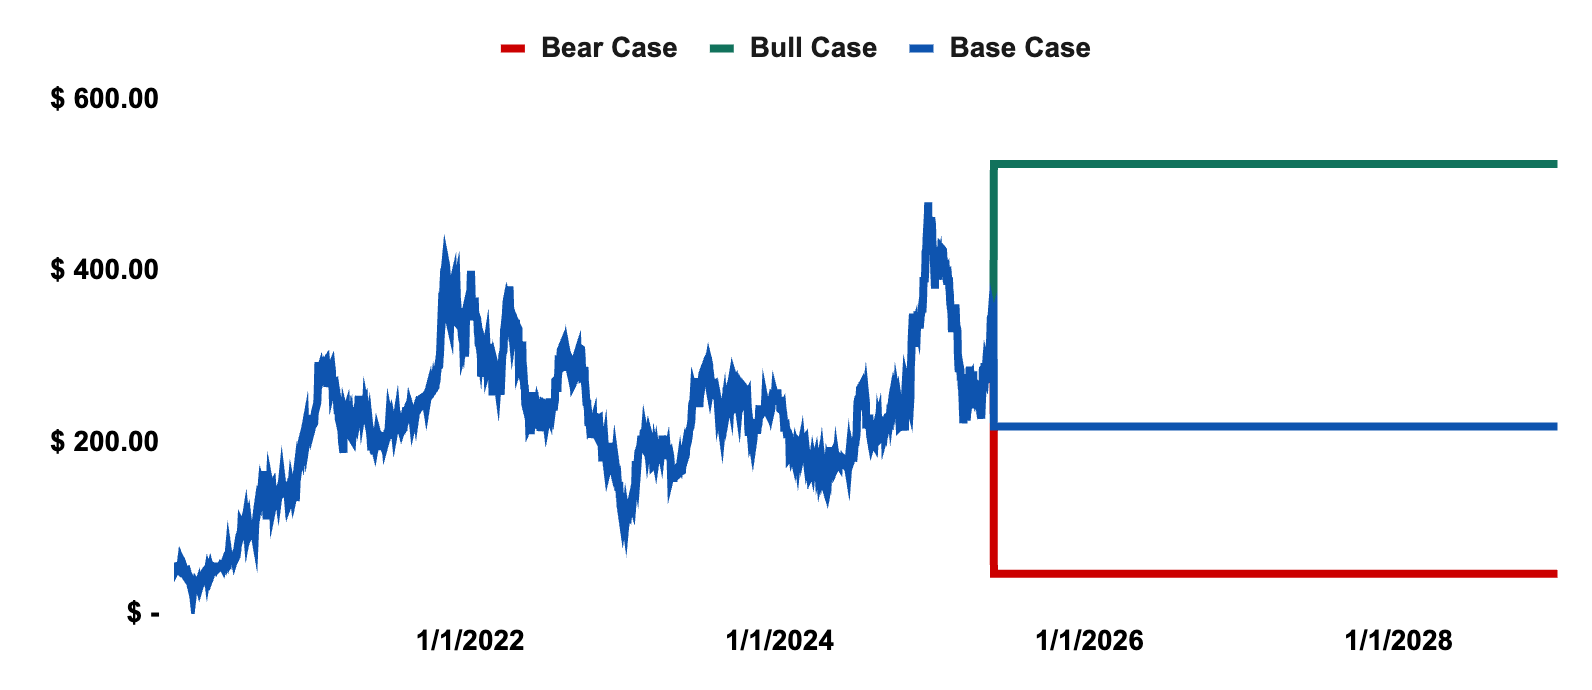
Tesla Share Price Evolution

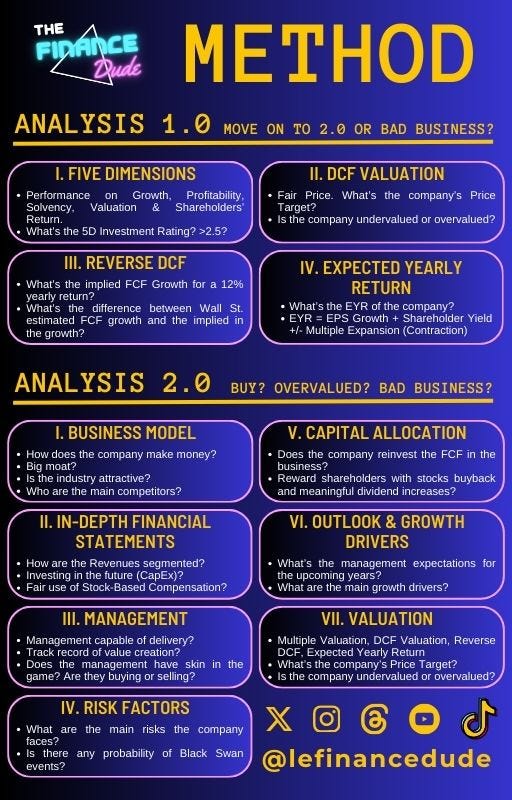
The Finance Dude Method
We’ll now run Tesla through The Finance Dude Method — a two-step system that separates hype from real business fundamentals.
In this post, we’ll complete Analysis 1.0:
A deep dive into Tesla’s growth, profitability, solvency, valuation, and shareholder returns to answer one key question:
Is Tesla good enough to move on to Analysis 2.0 — or is it just a well-marketed dream?
By the end of this post, you’ll know:
What the numbers really say about Tesla’s fundamentals
If the current valuation makes any sense
Whether this is an Upgrade to Analysis 2.0 or if it is red flagged and Blocked at the Analysis 1.0 Gate.
Let’s dive in. 🚀
🔬 I. Five Dimensions
Each metric from the five dimensions is rated from 1 to 5.
First Dimension: Growth 📈
Revenue Growth
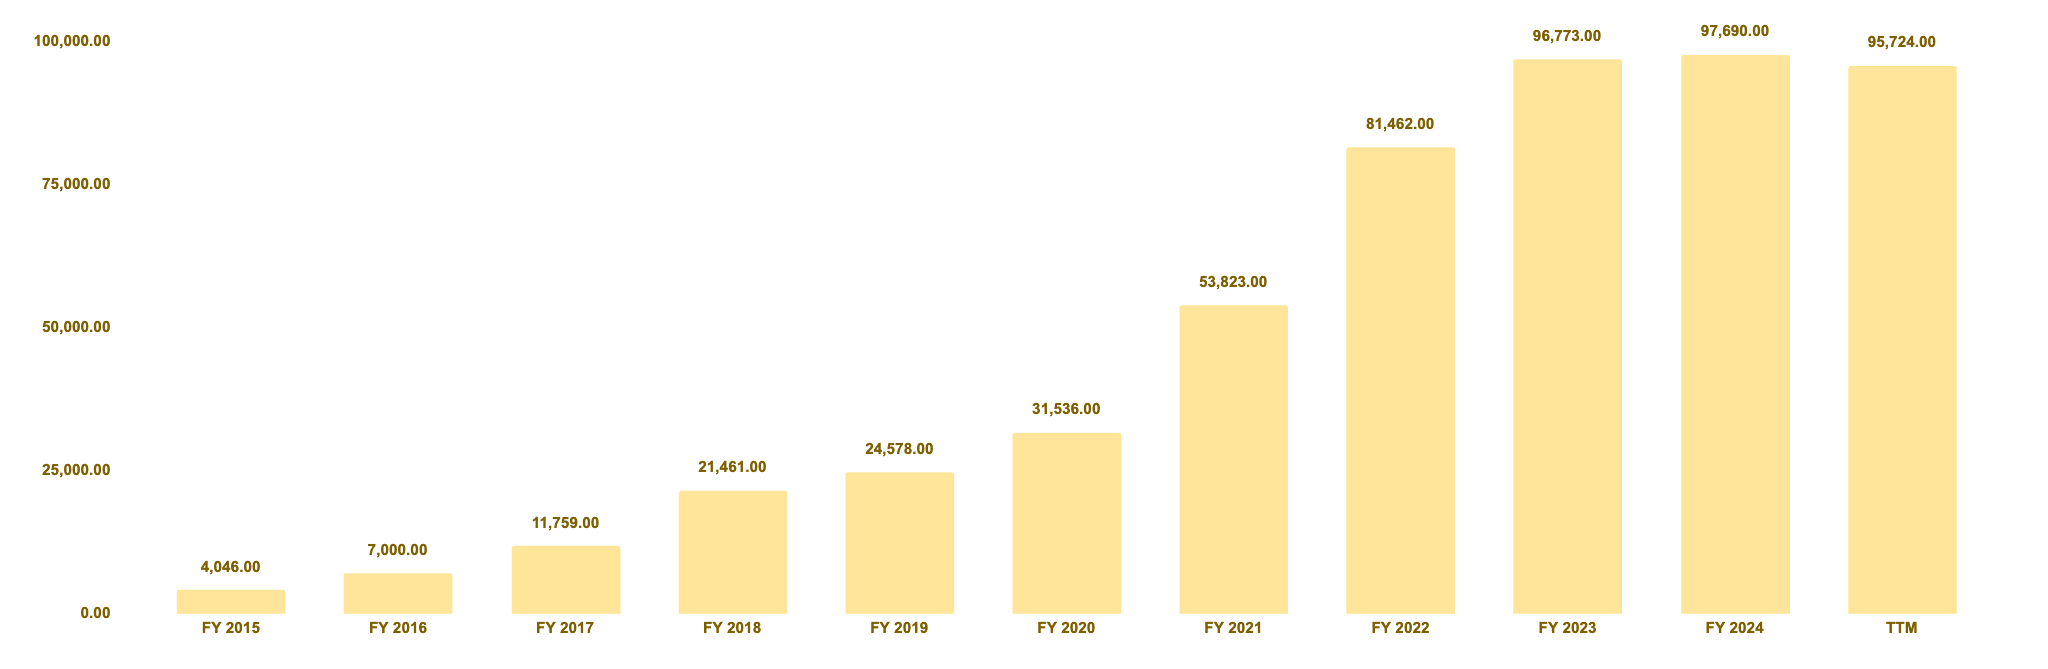
• FY 2015: $4.0B
• FY 2024: $97.7B
• TTM: $95.7B
• 5Y CAGR: 30.58%
• 10Y CAGR: 37.21%
• Rating: 5
📉 Tesla's revenue is plateauing after a decade of exponential growth. The slowdown is driven by a combination of EV market saturation in key regions, intensified price competition (especially from Chinese manufacturers), and delayed ramp-ups in newer business lines like energy and AI infrastructure. Without a new hit product or breakthrough in FSD monetization, revenue acceleration may remain constrained in the short term.
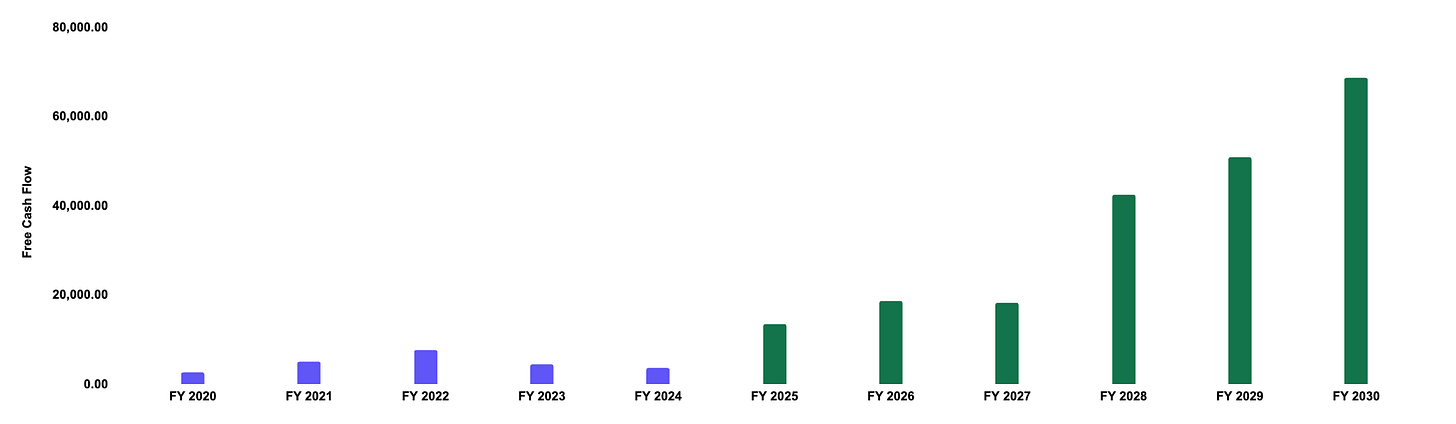
FCF Growth
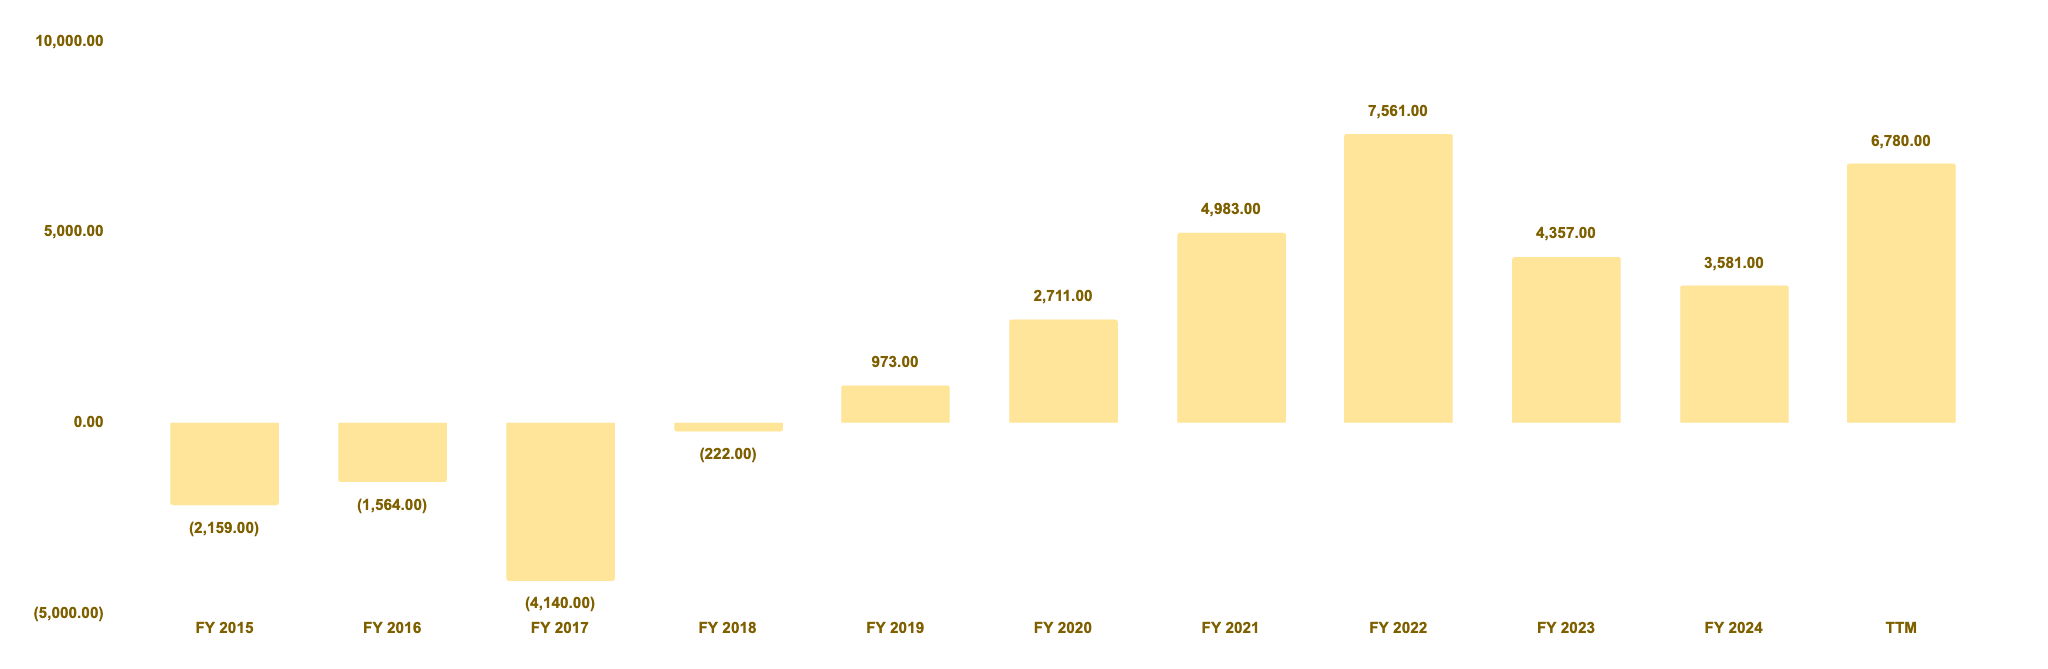
• FY 2015: $4.0B
• FY 2024: $97.7B
• TTM: $95.7B
• 5Y CAGR: 30.58%
• 10Y CAGR: 37.21%
• Rating: 5
🔍 Tesla’s FCF declined in 2022–2024 primarily due to aggressive price cuts to defend market share, rising input costs, and elevated capital expenditures on new factories, AI infrastructure (Dojo), Tesla Bot, and energy products. These pressures squeezed margins and cash conversion.
📈 The rebound in TTM reflects a stabilization in spending, better cost controls, and an improving cash generation profile as new facilities begin to scale and capital intensity eases.
Second Dimension: Profitability 💰
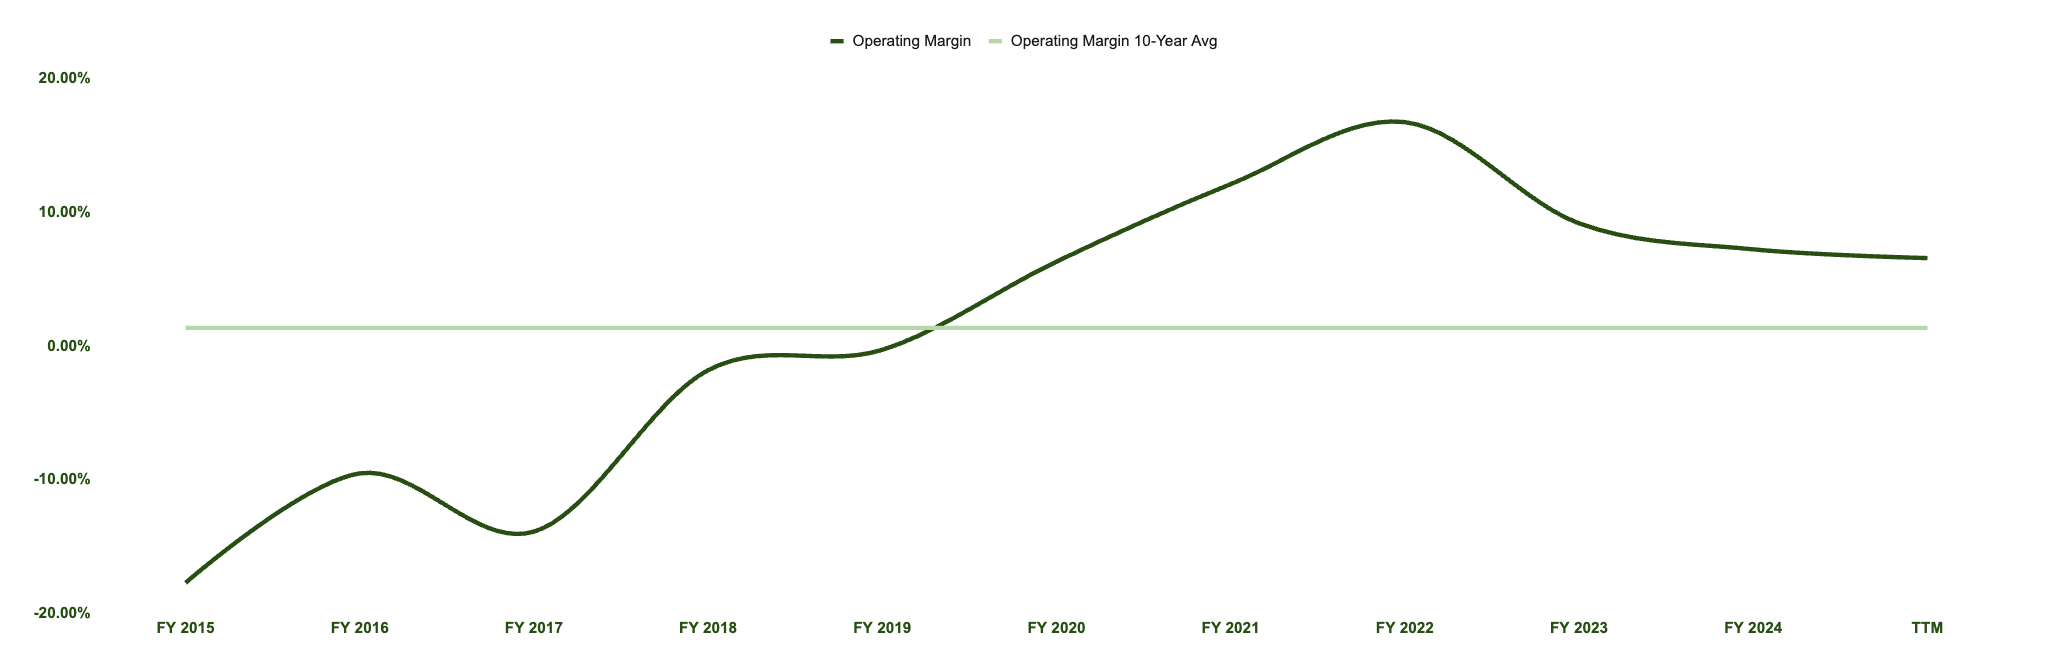
Gross Margin
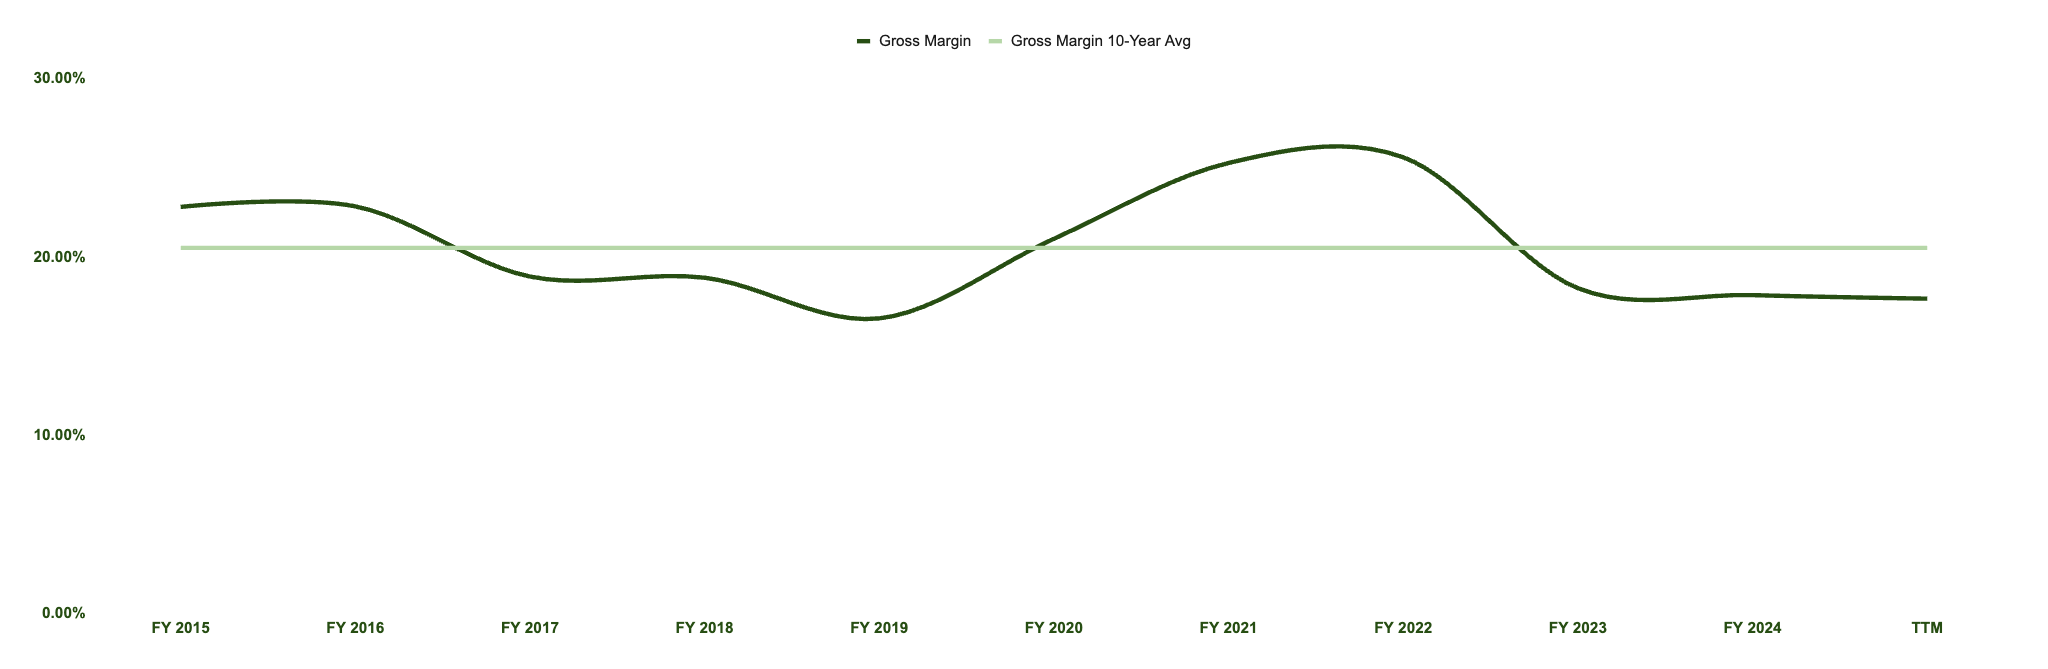
• FY 2015: 22.8%
• FY 2024: 17.86%
• TTM: 17.66%
• 10Y Avg: 20.5%
• Rating: 1
📉 Tesla's margins have declined from their post-pandemic highs. The contraction stems from several pressures: aggressive price cuts across multiple geographies to defend market share, rising raw material and logistics costs, and a surge in capital expenditures related to new factory builds, AI infrastructure (like Dojo), Tesla Bot development, and energy product scaling.
📈 Can margins improve again? Yes — but it depends. Recovery would require either:
• A successful rollout and monetization of high-margin services like Full-Self Driving (FSD) and AI/robotics
• A rebalancing of supply and demand that allows Tesla to raise prices without sacrificing volume
• Efficiency gains from new factories reaching full scale (e.g., Giga Texas, Giga Berlin)
• Lower input costs or better sourcing deals for batteries and componentsIn the most optimistic case, margin expansion could return gradually starting in 2026–2027, once the capex burden declines and software-driven revenue streams mature.
FCF Margin
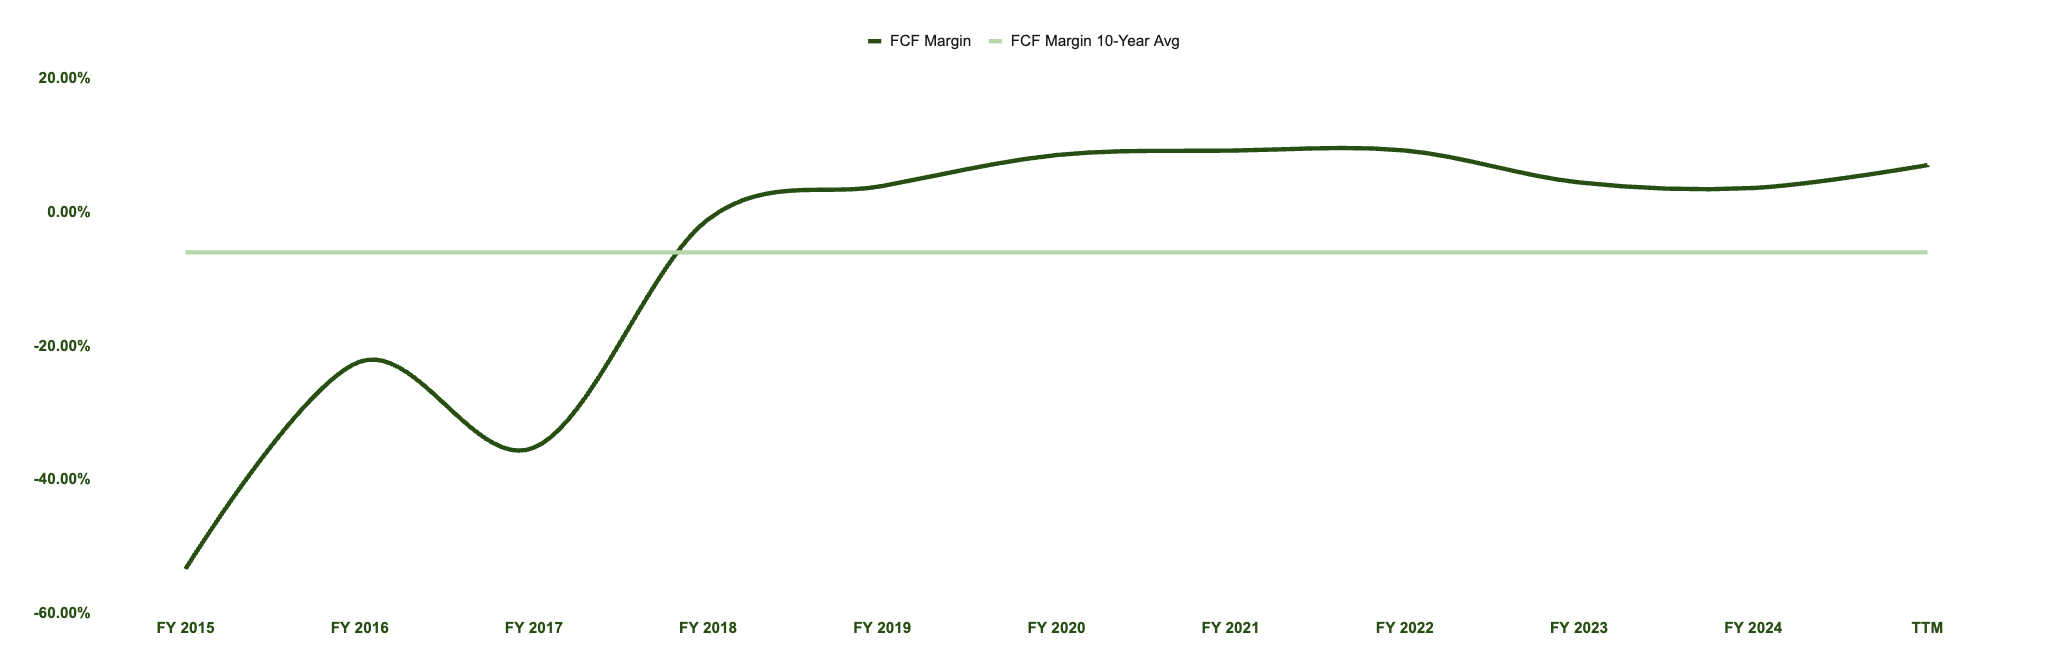
• FY 2015: -53.4%
• FY 2024: 3.67%
• TTM: 7.08%
• 10Y Avg: -5.96%
• Rating: 5
💡 Unlike Gross and Operating Margins, Tesla’s Free Cash Flow (FCF) Margin has remained relatively resilient. While pricing pressure and higher costs hit accounting margins post-2022, Tesla preserved and even improved its FCF margin due to working capital discipline, deferred capex realization, and lean operational execution.
🔍 This suggests that even under earnings pressure, Tesla continues to run a cash-efficient engine — a critical factor when internally funding massive R&D and infrastructure projects.
Third Dimension: Solvency 💸
Debt / Equity
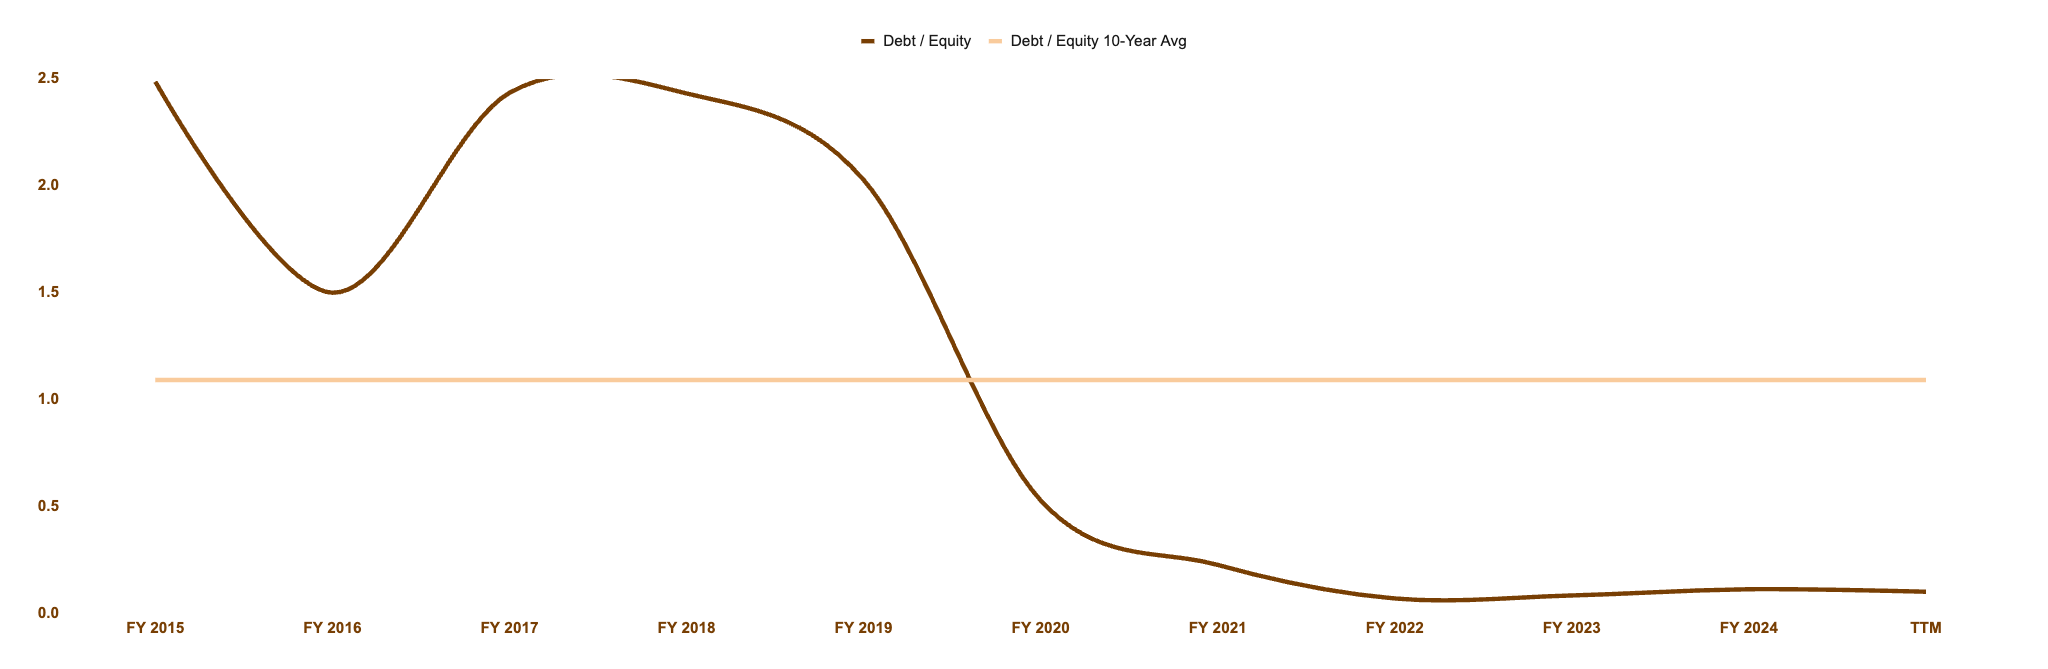
• FY 2015: 2.49
• FY 2024: 0.11
• TTM: 0.10
• 10Y Avg: 1.09
• Rating: 5
🏦 Tesla is a financial fortress. Over the past decade, it has transitioned from a highly leveraged company to one with virtually no debt. With a D/E ratio of just 0.10, Tesla’s balance sheet is pristine — and it holds more cash than debt. Investors should have zero concern about the company’s financial strength, giving it full flexibility to invest aggressively while weathering any economic shocks.
Debt / FCF
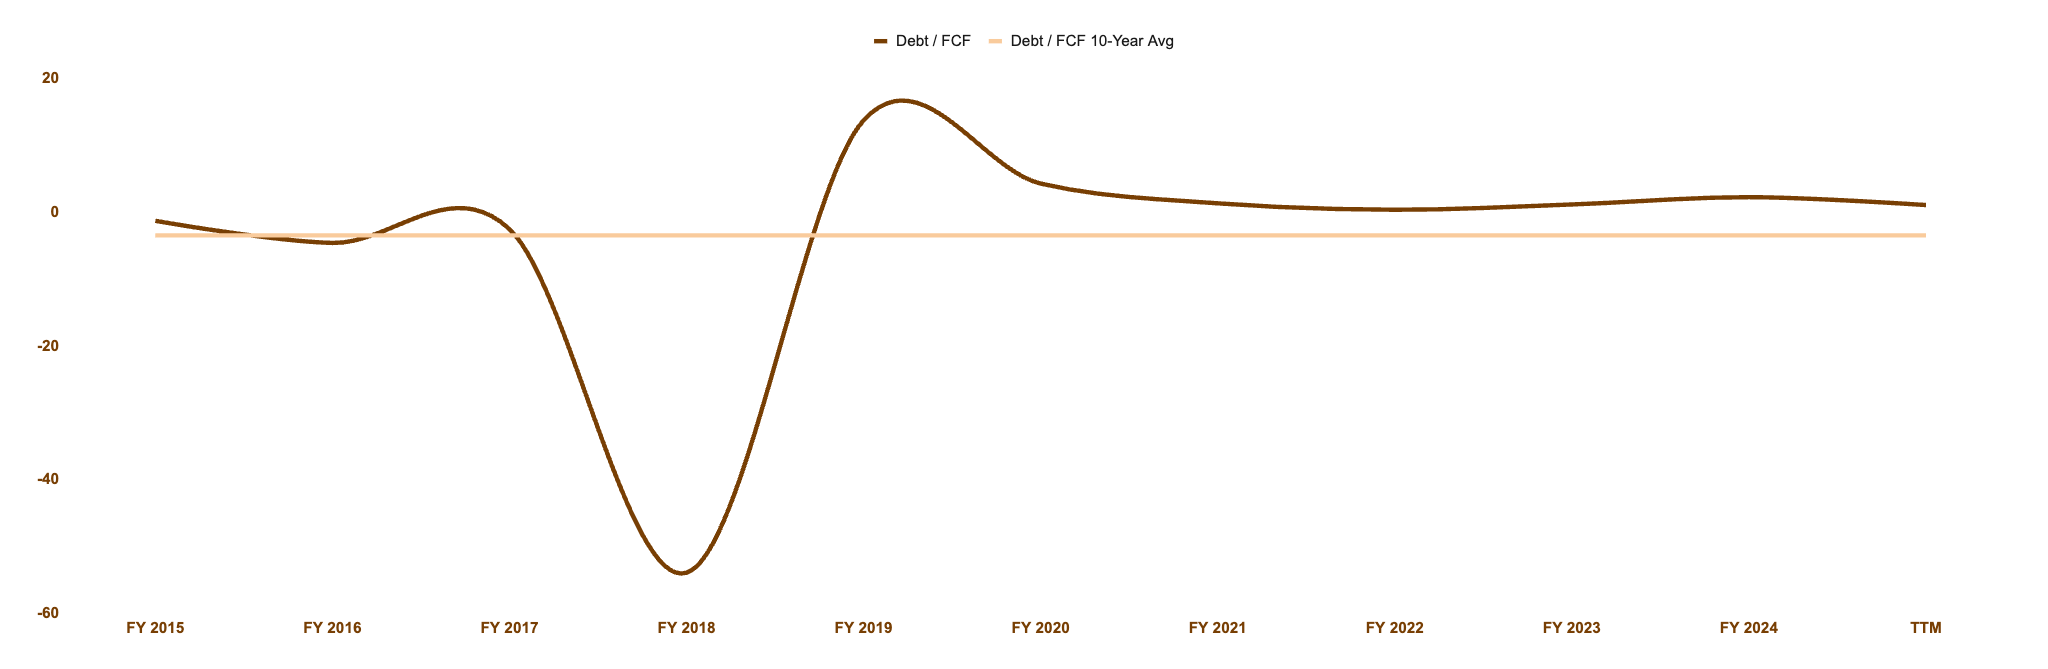
• FY 2015: -1.25
• FY 2024: 2.29
• TTM: 1.11
• 10Y Avg: -3.43
• Rating: 5
💸 Tesla’s debt is so low that it could be wiped out with just over a year’s worth of free cash flow. With a Debt/FCF ratio of 1.11, the company could theoretically pay off all of its financial obligations in just 13 months. That’s a rare financial position — and it speaks volumes about Tesla’s internal cash generation and disciplined capital structure. A fortress, indeed.
Fourth Dimension: Valuation 📉
EV / Sales
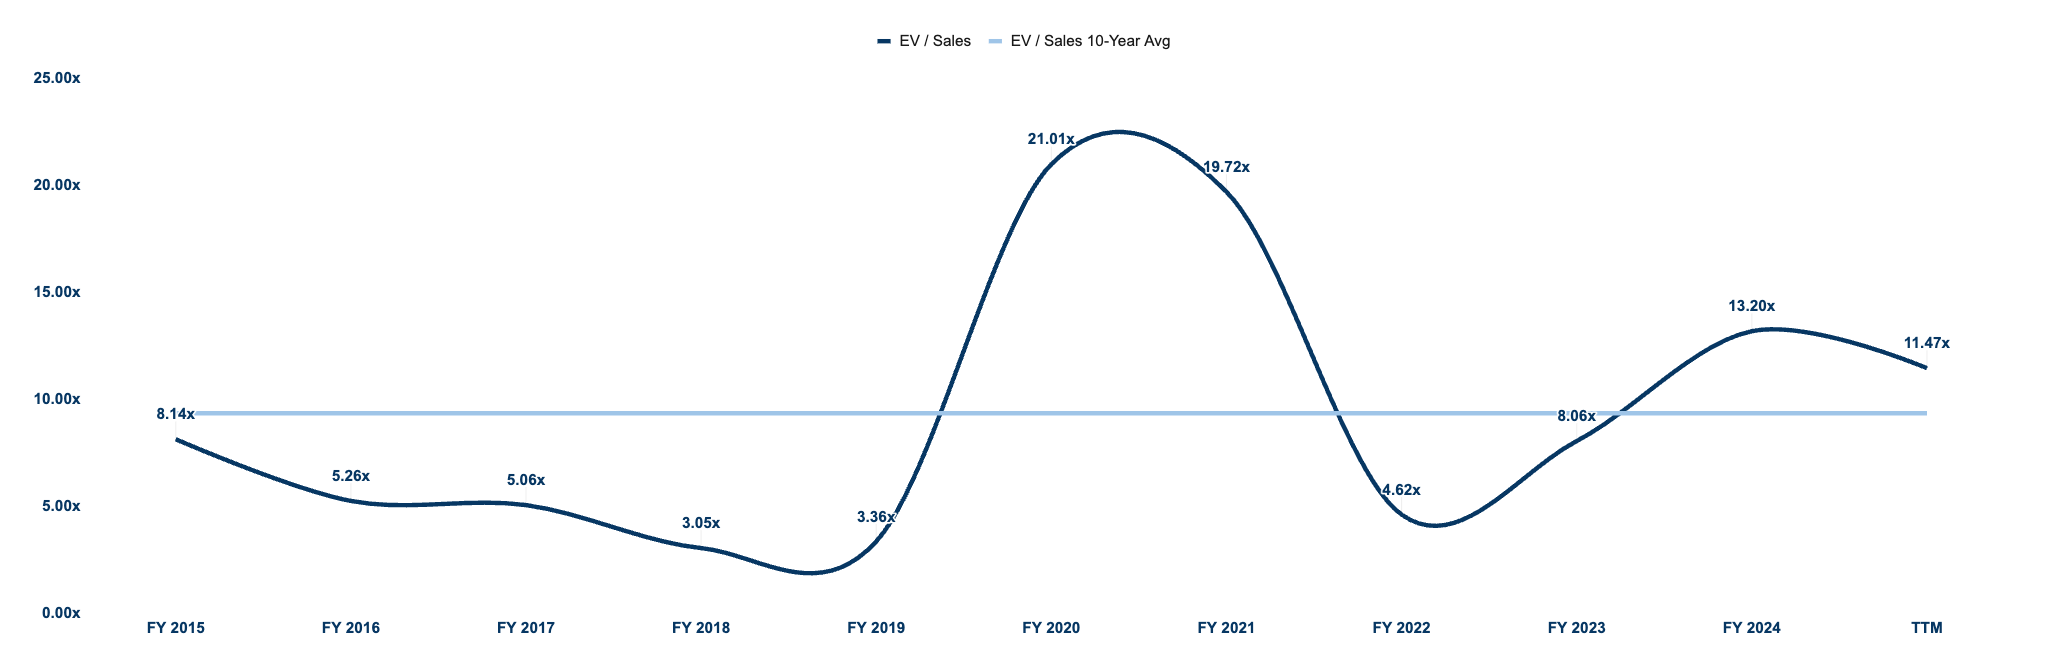
• FY 2015: 8.1x
• FY 2024: 13.2x
• TTM: 11.6x
• 10Y Avg: 9.37x
• Rating: 2
📊 Tesla’s EV/Sales multiple has settled into a middle ground. It’s no longer trading at the euphoric levels of 2020 (21.01x) and 2021 (19.72x), but it’s also far from the lows of 2022 (4.62x) and 2023 (8.06x). The current valuation still reflects meaningful growth expectations, though the market has clearly tempered its peak exuberance.
Price / FCF
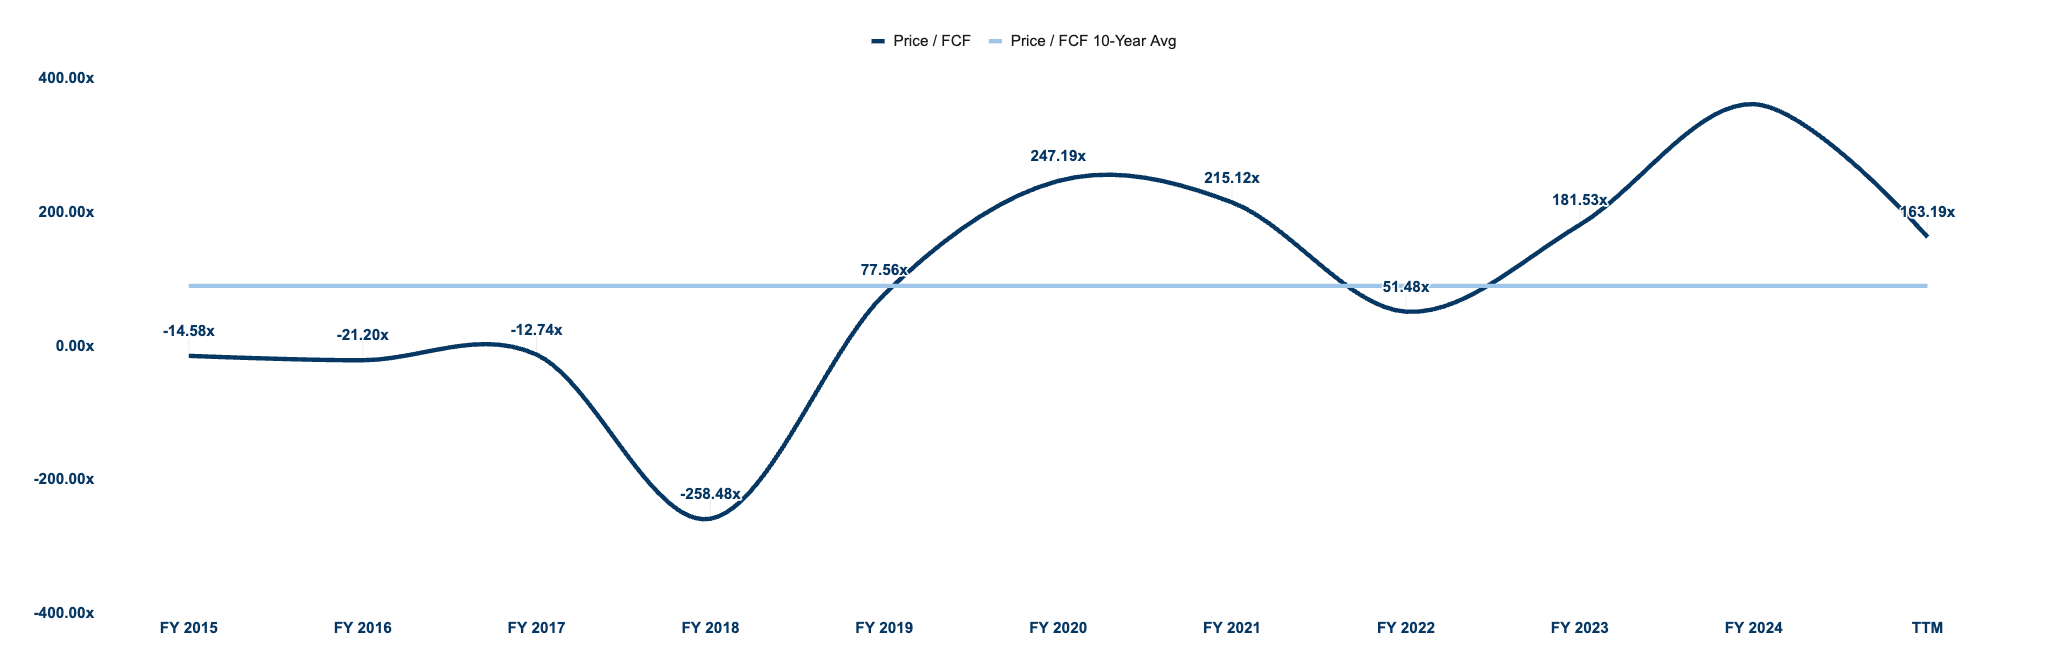
• FY 2015: -14.6x
• FY 2024: 362.2x
• TTM: 165.0x
• 10Y Avg: 90.3x
• Rating: 2
🚨 Tesla’s Price to Free Cash Flow (P/FCF) ratio remains extremely high. After peaking in 2024 at an astronomical 362x, it has moderated to 165x — still far above historical norms. This elevated multiple suggests that the market is pricing in strong long-term cash flow growth, leaving little room for error. While Tesla is a cash-generating machine, investors are paying a steep premium for that privilege.
Fifth Dimension: Shareholder Return 💵
Dividends: This company pays no dividends, so Dividend Growth, Dividend Yield and Payout Ratio are all rated 1.
Shares Outstanding
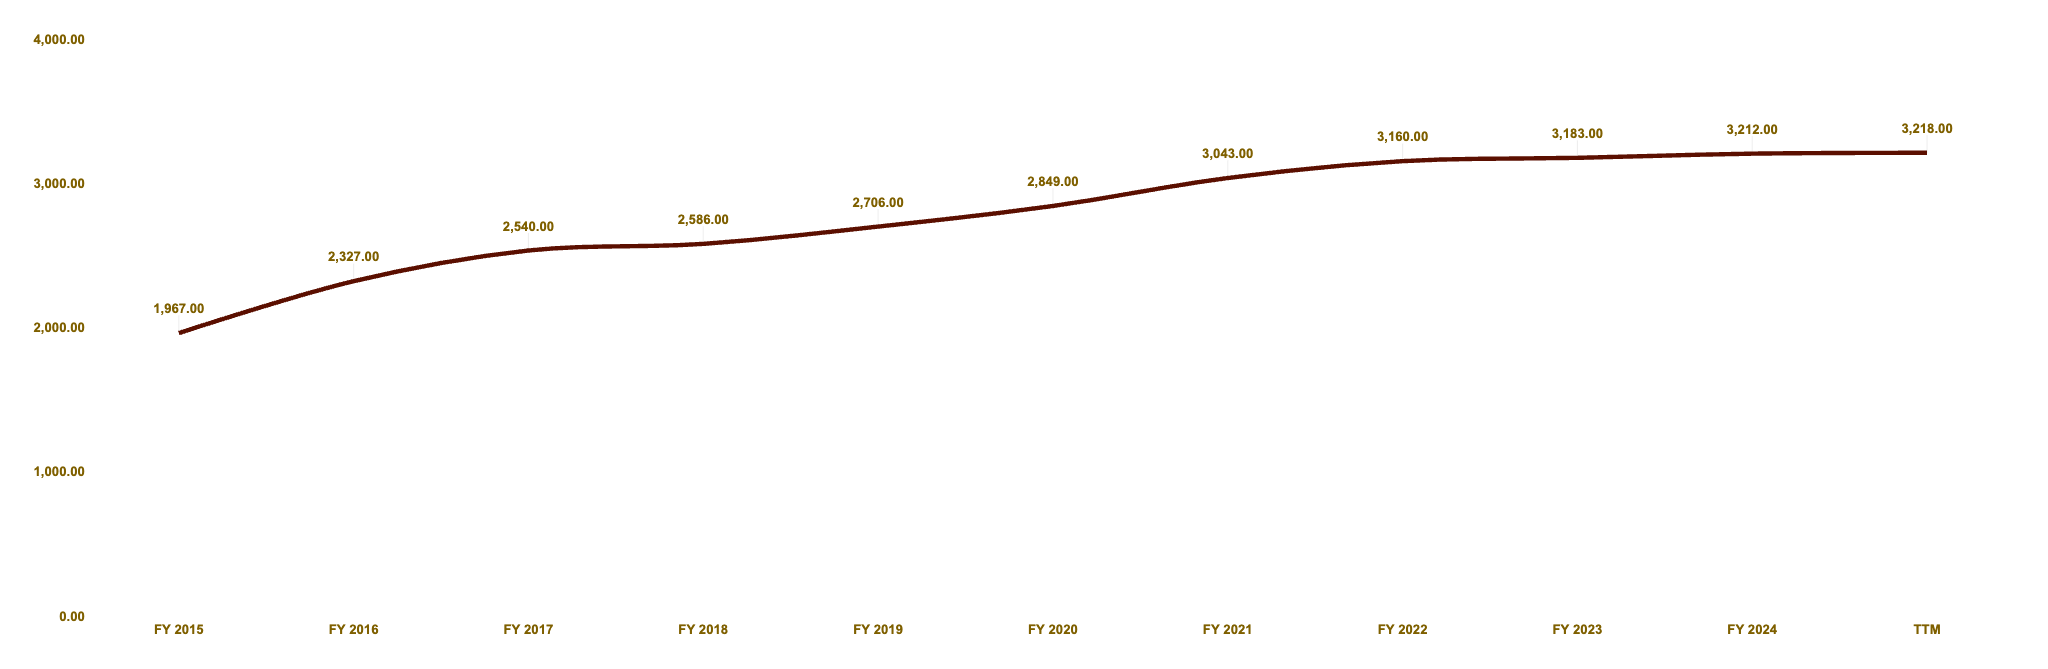
• FY 2015: 1.97B
• FY 2024: 3.21B
• TTM: 3.22B
• CAGR: 4.75%
• Rating: 1
📉 Tesla’s share count has steadily increased over the past decade, rising from 1.97B in 2015 to over 3.22B today — a CAGR of 4.75%. This reflects significant equity dilution, often used to raise capital during aggressive growth phases. While dilution has slowed recently, it still acts as a drag on per-share metrics like EPS and FCF per share, making every new share a little less valuable for existing shareholders.
📊 Five Dimensions Summary
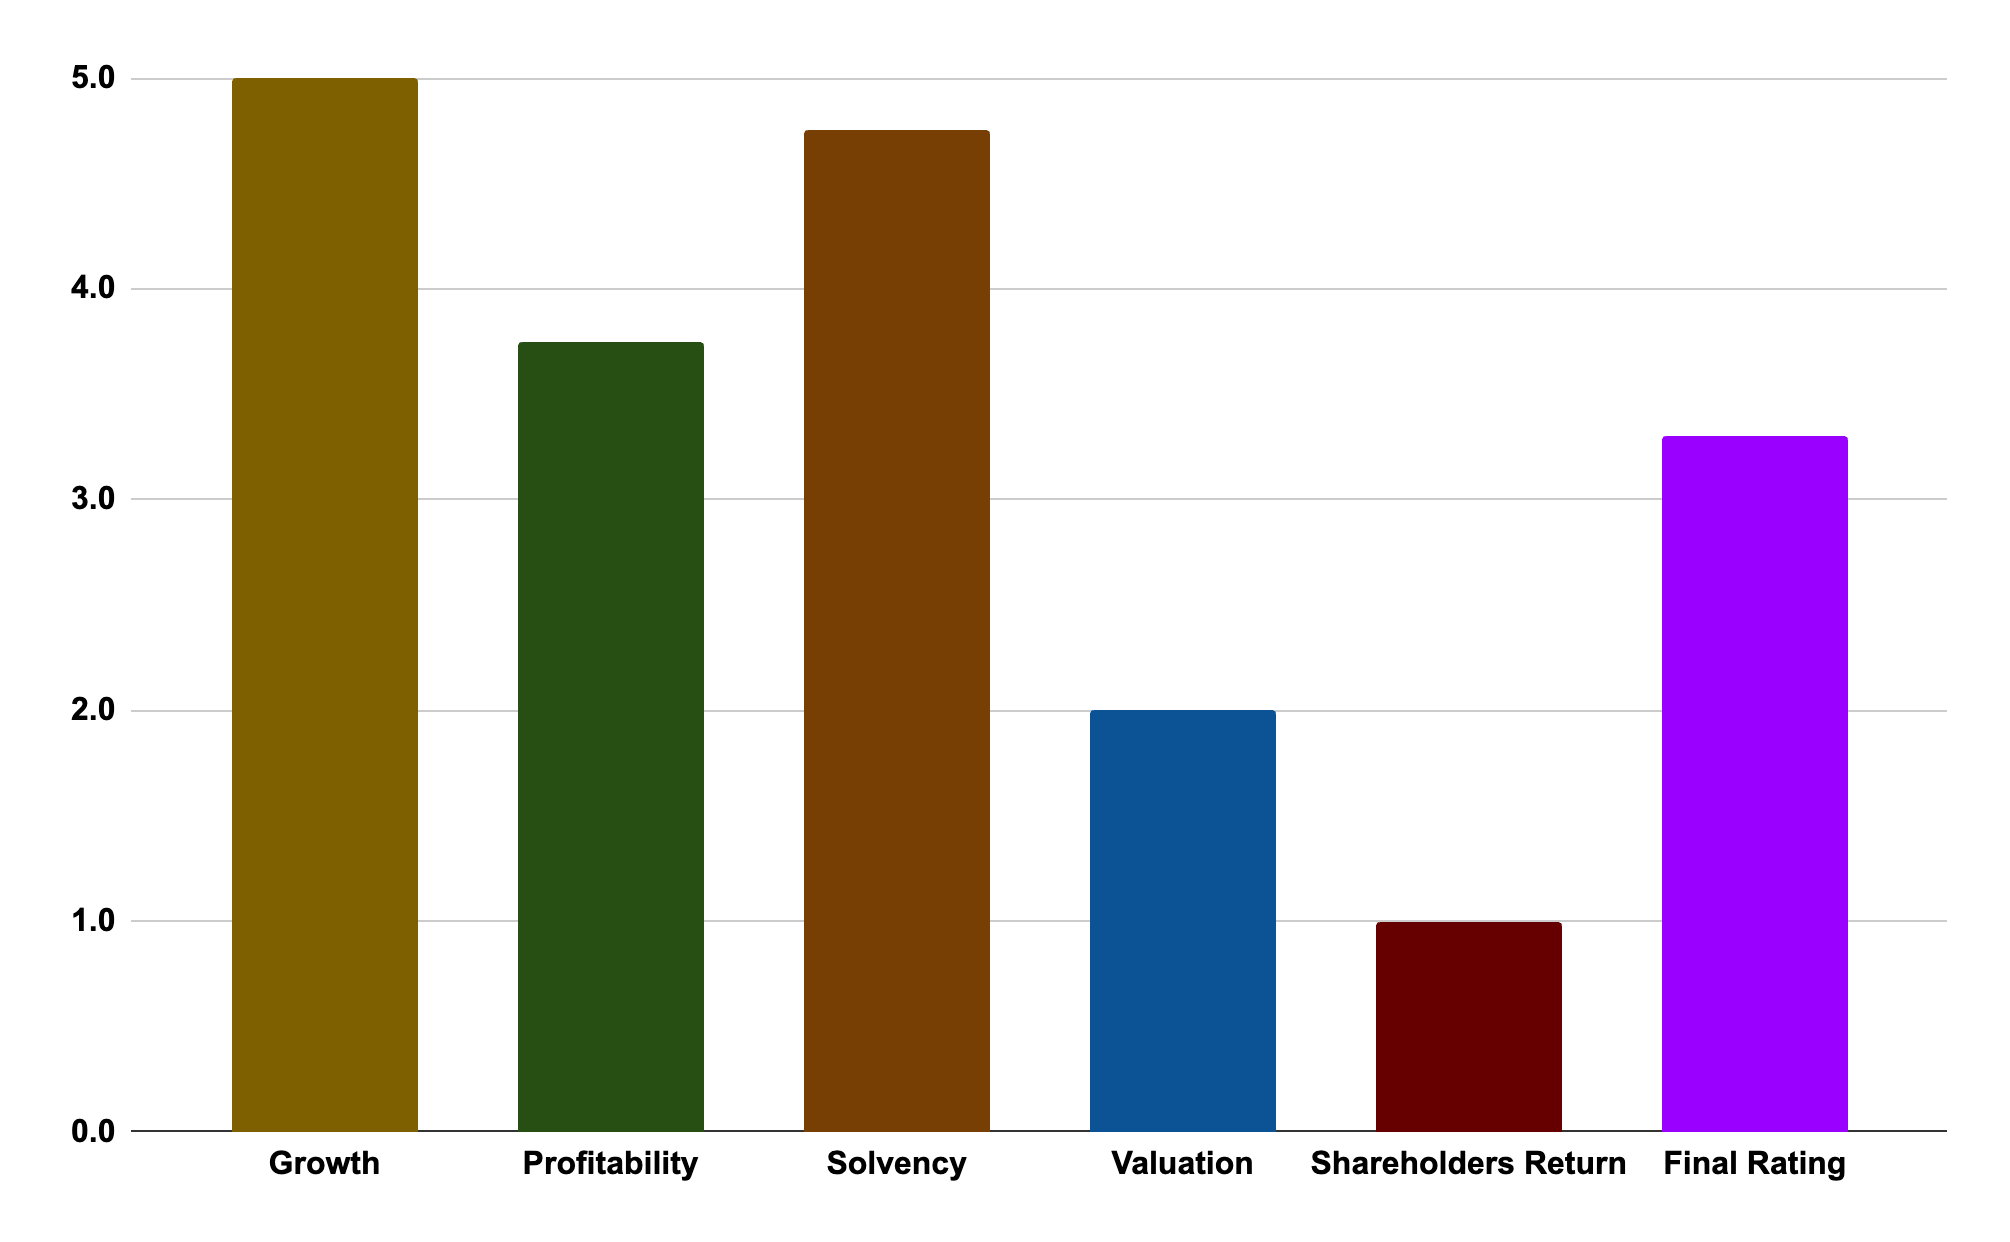
Growth: 5.0
Profitability: 3.8
Solvency: 4.8
Valuation: 2.0
Shareholder Return: 1.0
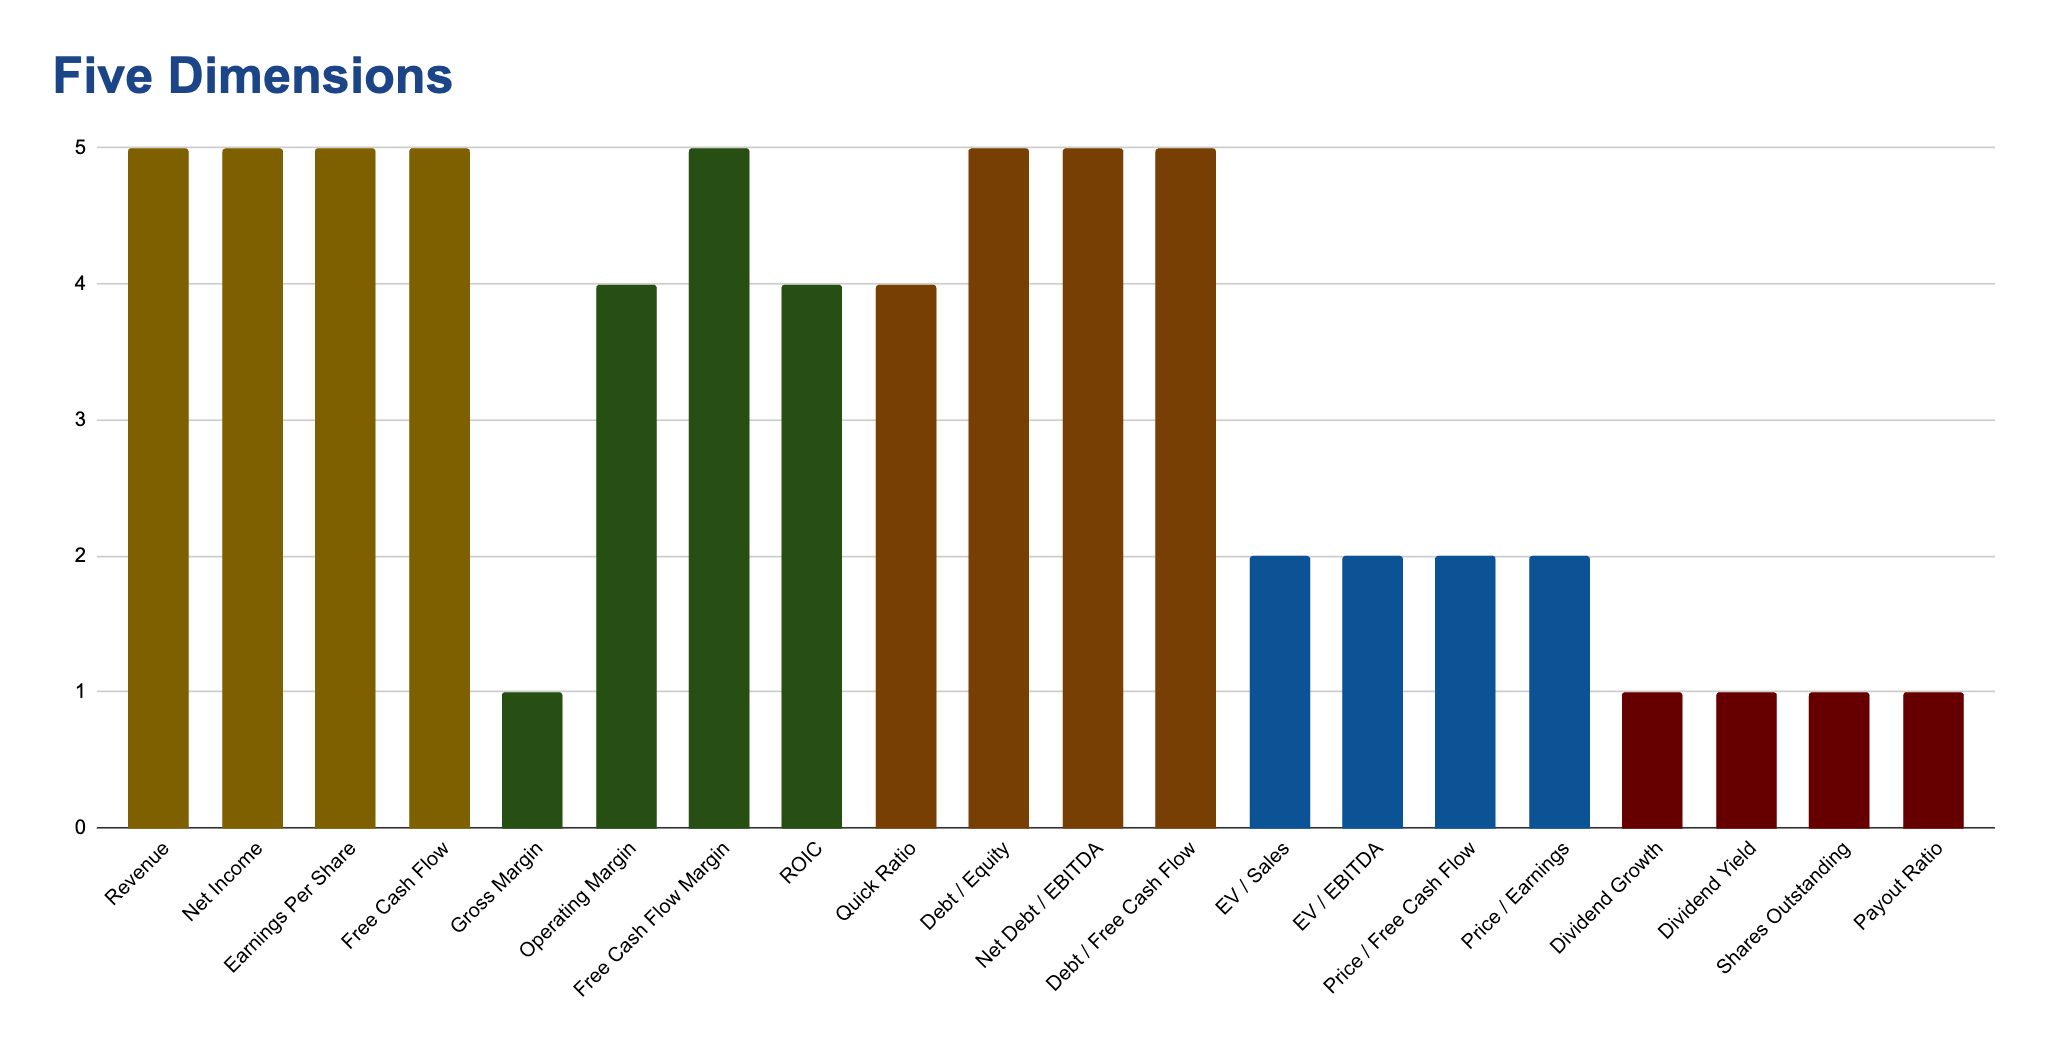
Final Rating: 3.3 / 5
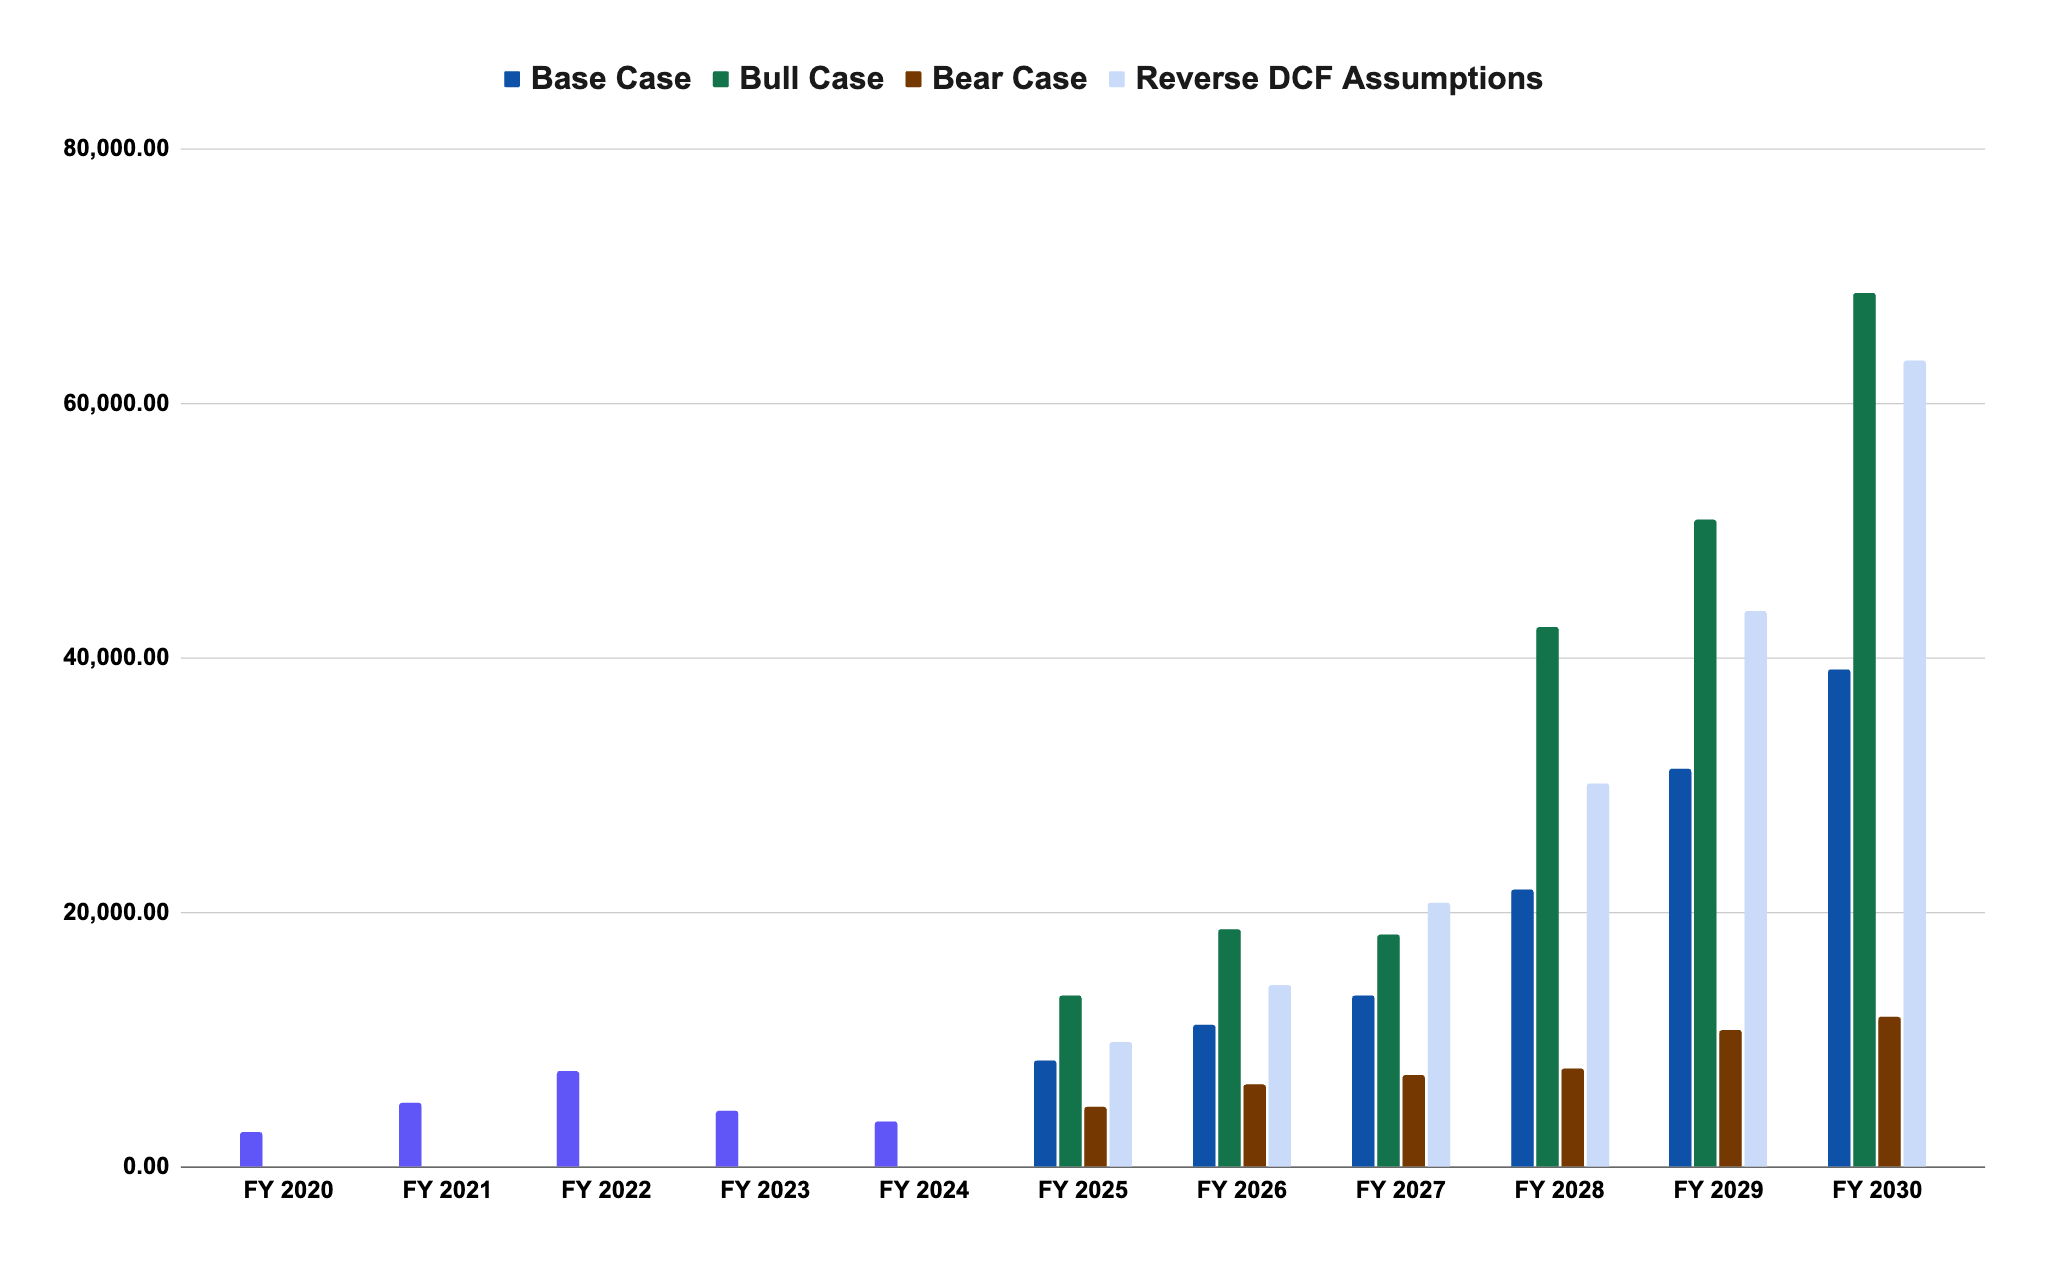
🧮 II. DCF Valuation
I employ Wall Street analysts' free cash flow projections to compute Tesla’s fair value. The average estimates of the next 5 years are utilized for a Base Case scenario, the highest estimates for a Bull Case scenario, and the lowest estimates for a Bear Case scenario.
🧮 Base Case: $217.80 → -37.4% downside
Solid business, modest returns. Tesla keeps growing, but slower than before. Competitive pressures force it to maintain lower prices, and margins remain below peak levels. This scenario assumes the EV transition continues worldwide — just not at breakneck speed. Tesla defends its current position but doesn’t expand dominance. Energy and software grow, but not enough to transform the margin profile. Tesla Bot remains in R&D phase, generating excitement but no material revenue.

🐂 Bull Case: $523.83 → +50.7% upside
Everything clicks perfectly. This scenario assumes Tesla hits on all strategic fronts: Full-Self Driving becomes widely adopted and monetized, Dojo proves to be a scalable edge in AI training, and Energy scales profitably. The Gen 3 vehicle line launches successfully, boosting volumes without destroying margins. Software revenue per vehicle surges. Margins recover to high-teens or even low-20s — aided by scale, vertical integration, and reduced cost pressures. Tesla Bot progresses from prototype to real-world utility, opening up a high-margin, futuristic revenue stream. This case also relies on smooth macro conditions and zero geopolitical frictions. It’s Tesla firing on every possible cylinder.
🐻 Bear Case: $46.18 → -86.7% downside
The hype unravels. Tesla misses on multiple fronts: Full-Self Driving stalls, Dojo underdelivers, and Gen 3 faces costly delays. Vehicle margins continue to erode from ongoing price wars, and Tesla loses its tech-premium edge. The energy segment underwhelms, and regulators either delay or block autonomy altogether. If macro conditions also turn hostile, the combination of weak innovation and shrinking margins paints a brutal picture. This is a scenario where Tesla's dreams remain dreams — and the market punishes it hard.

Weighted Average: $244.68 → -29.6% downside
📉 Tesla still looks overvalued under most realistic assumptions.
If software monetization and FSD adoption fall short, and margins fail to rebound, the stock offers more downside than upside. While this is a risk worth monitoring, I believe the Bull Case is more likely than the Bear. Tesla is uniquely positioned to capitalize on multiple high-margin growth vectors — from Dojo to FSD to Tesla Bot — and if even part of that vision materializes, today’s price will look far more justified than feared.
🔁 III. Reverse DCF
A Reverse DCF tells us what growth expectations are priced into the stock to deliver a 12% annual return - my required rate of return. If the required growth rate is too high vs. Wall Street expectations, the stock may be overvalued.
Key Assumptions:
• FY 2024 FCF: $6.78B
• Discount Rate: 12%
• Exit Multiple: 30x
Results:
• Wall Street Projected FCF Growth: 37.2%
• Implied Growth Needed for 12% Return: 45.2%
• Growth Gap: -7.9%
❗ The market is pricing in more growth than the expectations of the average analyst — and that's a problem.
To justify a 12% annual return at today’s valuation, Tesla would need to grow free cash flow at a 45.2% CAGR over the next five years. Wall Street’s average consensus? Just 37.2%. That 8-point gap might seem small — but it’s massive when we’re talking about billions in FCF. This mismatch means Tesla is priced for near-perfection. Unless Dojo, FSD, and new products like Tesla Bot hit at full scale — and quickly — the stock could face harsh reality checks.
💹 IV. Expected Yearly Return
This model calculates the expected return based on EPS growth, shareholder yield, and valuation contraction or expansion.
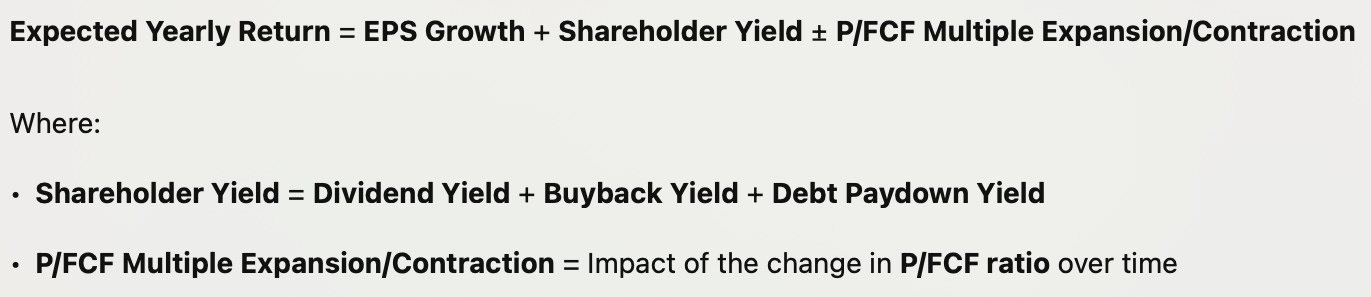
Assumptions:
Expected Yearly Return Breakdown
EPS Growth: 37.2%
Shareholder Yield: -0.06%
Dividend Yield: 0.0%
Buyback Yield: -0.12%
Debt Paydown Yield: 0.05%
Valuation Impact
Current P/E: 175.6x
Exit P/E: 30x
Total Expected Return: 7.41%
📉 Growth can't outrun gravity.
Tesla’s projected EPS growth is stellar at 37.2% annually, but the math breaks down when you start from a sky-high multiple of 175.6x earnings and return to earth at 30x. That massive valuation contraction acts as a drag on total returns, wiping out much of the upside from earnings growth. With no dividends, no buybacks, and a negative shareholder yield, almost everything rests on EPS expansion — and even then, the return barely clears 7%. It’s a strong business priced like a legend.
🧠 V. Final Summary & Verdict
🎯 Final Rating: 3.3 / 5
✅ Strengths:
World-class growth
Solid operating leverage improvements
Strong balance sheet
Resilient FCF
⚠️ Weaknesses:
Collapsing margins
Extremely high valuation multiples
No shareholder returns (dividends/buybacks)
🧮 DCF Valuation - Upside/Downside Potential: -29.6% (Weighted DCF)
Most valuation scenarios show downside
🔁 Reverse DCF - Growth Gap: -7.9%
Market expectations exceed average Wall Street estimates
💹 Expected Yearly Return: 7.4%
Just 7.4%, driven mostly by EPS growth — valuation compression is a drag
🌱 Future Growth Drivers:
AI infrastructure (Dojo)
Tesla Bot
Full-Self Driving monetization
Energy segment (Megapack, Powerwall)
Global vehicle expansion with Gen 3 platform
⚠️ Risks to Consider:
Price wars in EVs
AI and FSD execution risk
Geopolitical/regulatory risks
Margin pressure from scaling and capex
🏁 Verdict:
🟢 🚀 Upgrade to Analysis 2.0
Despite revenue growth slowing, profitability deteriorating, and sky-high valuation multiples pricing in perfection, I’m not closing the door on Tesla just yet. The company remains one of the most innovative players in the world — sitting at the intersection of AI, robotics, clean energy, autonomy, and manufacturing. While uncertainty around execution and scale of its futuristic bets (like Dojo, Tesla Bot, and FSD) still clouds the picture, the sheer ambition and technological potential make this business too compelling to ignore.
That’s why I’m upgrading it to Analysis 2.0 — not because it’s a buy today, but because I believe the next layer of the story is worth exploring.
Whenever you’re ready!
The Finance Dude is all about securing your financial future.
Whenever you're ready, here's how I can help you:
📅 Daily Updates: My take on daily macro events and earnings reports.
🗓️ Weekly Recaps: A summary of the week’s most important financial events.
📊 Stock Analyses: Access to a comprehensive library of all previously analyzed stocks and exclusive, detailed, and data-driven analysis of new stocks.
✅ Monthly Best Buys: A monthly list of the top-5 stocks for that month.
📈 Watchlist & Portfolio: Exclusive access to my current watchlist and portfolio.
⏰ Live Tracking: Receive alerts when I buy or sell a stock.
🧮 Interactive Tools: Downloadable Excel files where you can play and make your own assumptions for the valuation of the stocks I analyze.
🎓 Learn: Weekly posts explaining key financial concepts.
Don’t forget to subscribe to my channel and stay tuned for the next analyses! 🫡
👉 For more insights from me, follow me on:
X: @LeFinanceDude
Instagram: @LeFinanceDude
YouTube: youtube.com/@lefinancedude
TikTok: @LeFinanceDude