
Why McDonald's is Poised for Continued Success: Leveraging AI and Tech for Future Growth
McDonald's Analysis 1.0 - July 2024

Hi Dude ✌️
Welcome to this free Analysis 1.0!!! 🆓
In case you missed it:
If you haven’t yet, subscribe to get access to these posts, and also:
📅 Daily Updates: My take on daily macro events and earnings reports.
🗓️ Weekly Recaps: A summary of the week’s most important financial events.
📊 Stock Analyses: Access to a comprehensive library of all previously analyzed stocks and exclusive, detailed, and data-driven analysis of new stocks.
✅ Monthly Best Buys: A monthly list of the top-5 stocks for that month.
📈 Watchlist & Portfolio: Exclusive access to my current watchlist and portfolio.
⏰ Live Tracking: Receive alerts when I buy or sell a stock.
🧮 Interactive Tools: Downloadable Excel files where you can play and make your own assumptions for the valuation of the stocks I analyze.
🎓 Learn: Weekly posts explaining key financial concepts.
McDonald's Analysis 1.0
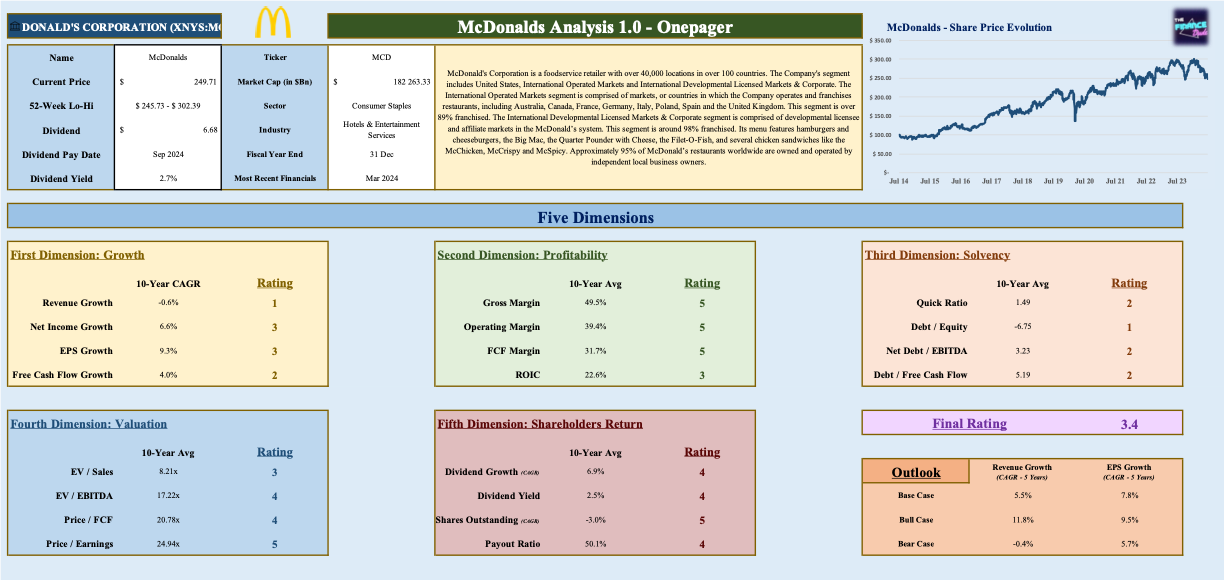
Company Overview
🏢 Company name: McDonald's
🔎 Ticker: MCD
📈 Current Stock Price: $250.00
⚖️ 52-Week Lo-Hi: $245.73 - $302.39
🗄️ Sector: Consumer Staples
🗂️ Industry: Restaurants
💰 Market cap: $182.48 Billion
💵 Dividend Yield: 2.7%
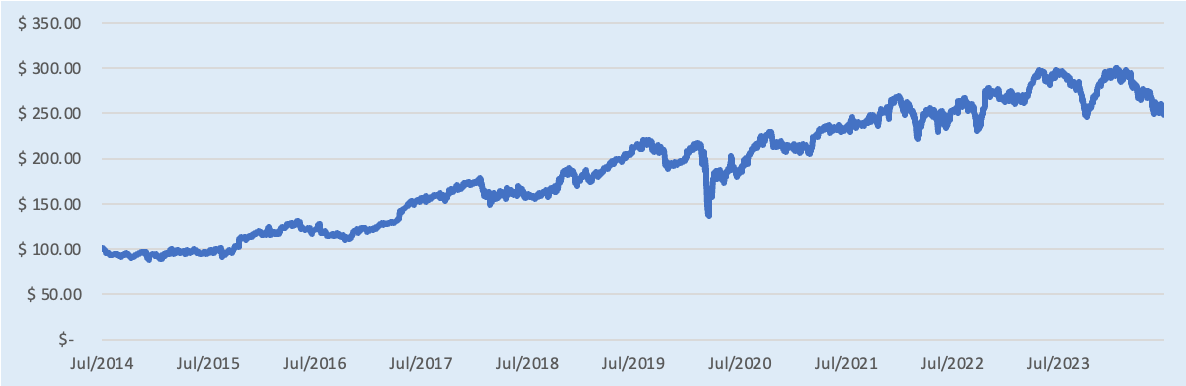
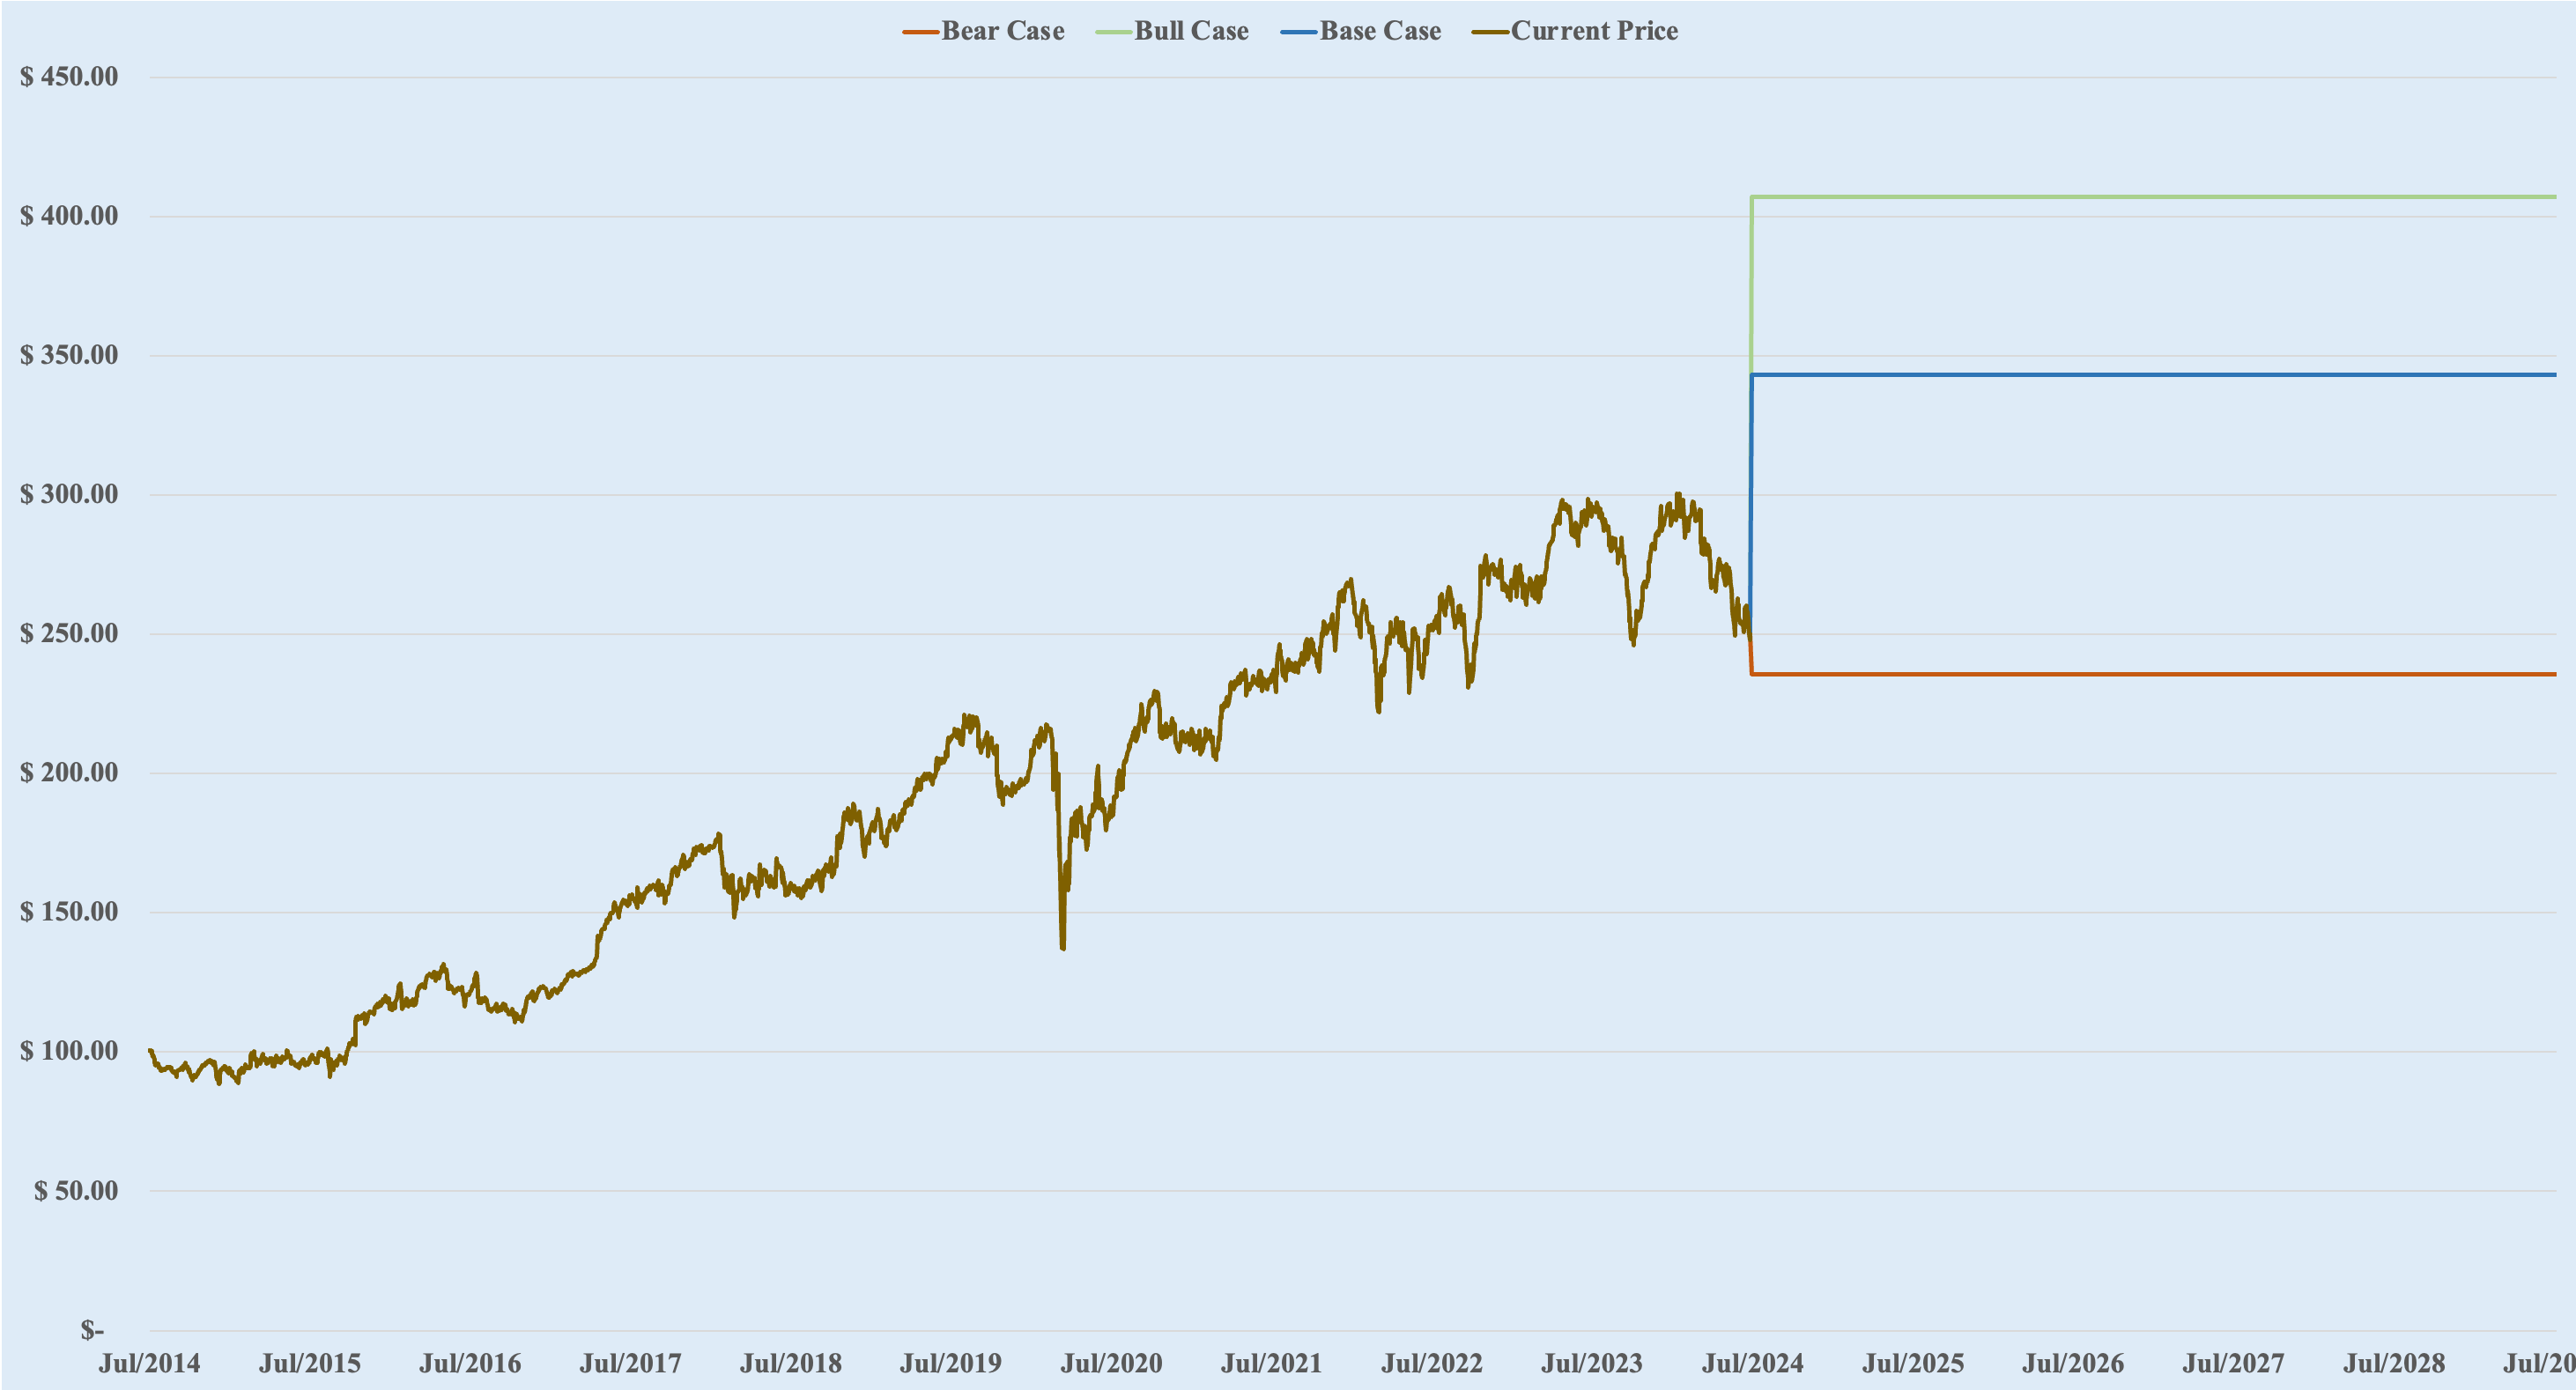
McDonald’s Share Price Evolution
McDonald's Corporation is a foodservice retailer with over 40,000 locations in over 100 countries. The Company’s segments include United States, International Operated Markets, and International Developmental Licensed Markets & Corporate. Approximately 95% of McDonald’s restaurants worldwide are owned and operated by independent local business owners.
McDonald’s Onepager
I. Five Dimensions
First Dimension: Growth 📈
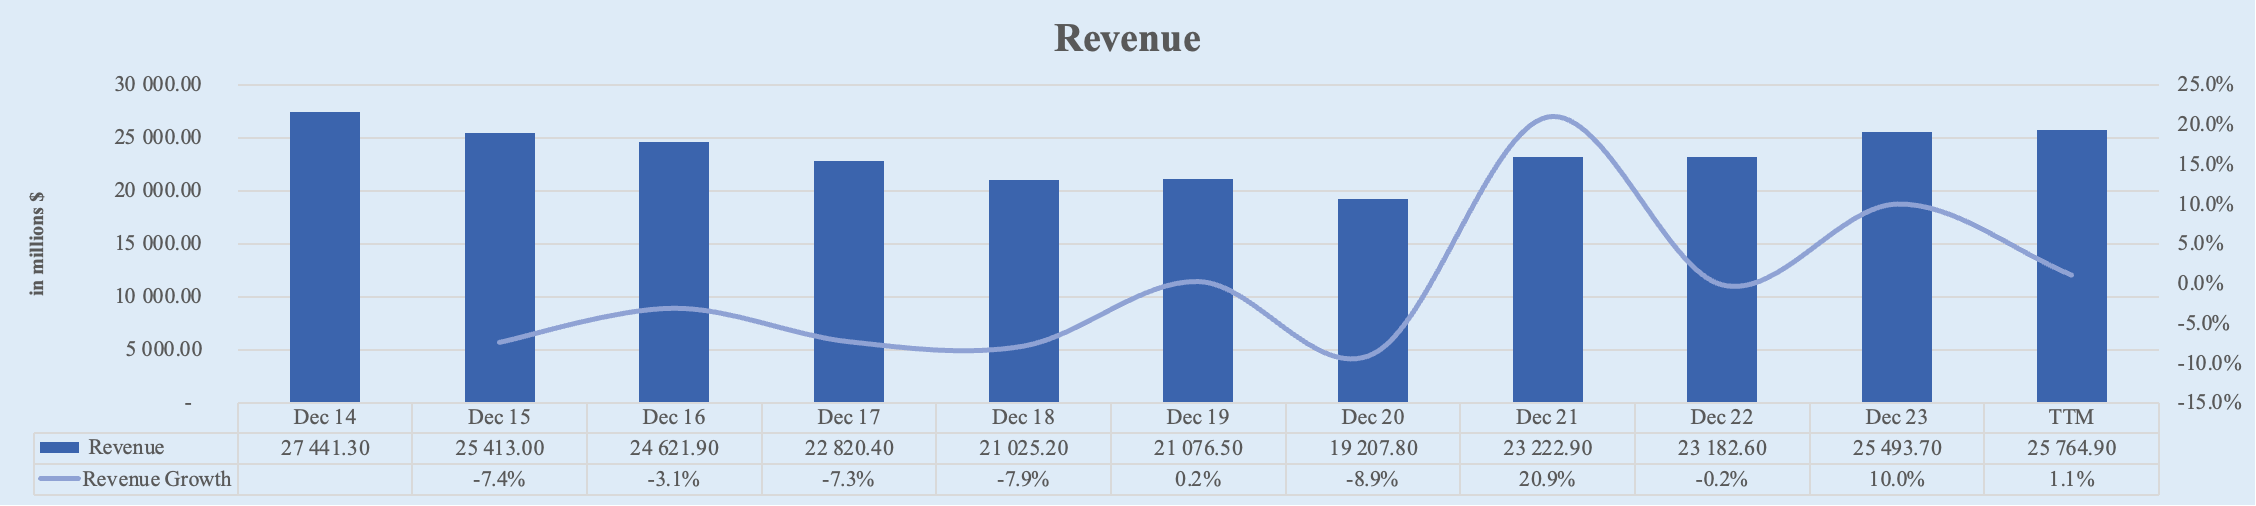
Revenue Growth
McDonald's revenue declined by 30% from 2014 to 2019, primarily due to the following key factors:
Strategic Shift to Franchising: McDonald's increased its focus on franchising its restaurants. While this strategy improved margins and reduced operational complexity, it led to lower revenue from company-operated stores, which was a significant portion of total revenue previously. The number of company-operated restaurants in 2014 was 6,714 vs 29,544 franchised restaurants. By 2023, McDonald's had 39,680 franchised restaurants compared to 2,142 company-operated ones. This shift has been part of a long-term strategy to reach a goal of having 95% of its restaurants franchised. There are a few reasons for this shift:
Increased Profitability: Franchising allows McDonald's to benefit from a stable and predictable revenue stream through franchise fees and royalties without the high operational costs associated with running company-owned restaurants. This model significantly improves margins and overall profitability.
Operational Efficiency: By franchising, McDonald's reduces the complexities and risks of day-to-day operations, enabling it to focus on strategic initiatives, marketing, and product development. Franchisees, who are local business owners, bring local market expertise and are highly motivated to maximize their restaurant's performance.
Capital Expenditure Savings: Franchising shifts the capital expenditure burden to franchisees, allowing McDonald's to expand its footprint more rapidly and efficiently without significant capital investment.
Scalability and Growth: The franchise model supports rapid expansion and scalability. Franchisees invest in the brand, spreading the financial risk and enabling McDonald's to grow its presence globally with less direct investment from the corporation.
Market Challenges and Competition: The company faced intense competition from other fast-food chains and evolving consumer preferences towards healthier and diverse food options. This shift required continuous adaptation, which sometimes did not align with McDonald's traditional offerings.
Currency Fluctuations: Being a global entity, McDonald's revenue was negatively impacted by currency fluctuations, especially the strengthening of the U.S. dollar against other currencies, which reduced the reported revenue from international markets.
To address these challenges and achieve a revenue turnaround post-2019, McDonald's implemented several strategic measures:
Accelerating the Arches Strategy: This comprehensive strategy focused on enhancing customer experience, menu innovation, and digital transformation. It included expanding digital capabilities, such as mobile app ordering, delivery services, and loyalty programs, which significantly boosted sales.
Operational Efficiencies: McDonald's optimized its operations through better supply chain management and cost control measures. This helped improve margins and profitability, contributing to higher net income and EPS.
Menu Innovations: The introduction of popular new menu items and limited-time offerings helped attract more customers. McDonald's also focused on improving the quality of its core menu items, which resonated well with consumers.
Digital and Delivery Expansion: Investments in digital ordering, delivery partnerships, and enhancing the overall digital customer experience played a crucial role in driving growth. The increase in sales through digital channels was a major factor in the company's revenue growth.
These measures collectively resulted in a 34% revenue growth since 2019, reflecting a successful turnaround after years of decline.
FY 2014: $27,441.30M
FY 2023: $25,493.70M
TTM: $25,764.90M
1-Year Change: 1.1%
5-Year CAGR: 4.1%
10-Year CAGR: -0.6%
Rating: 1
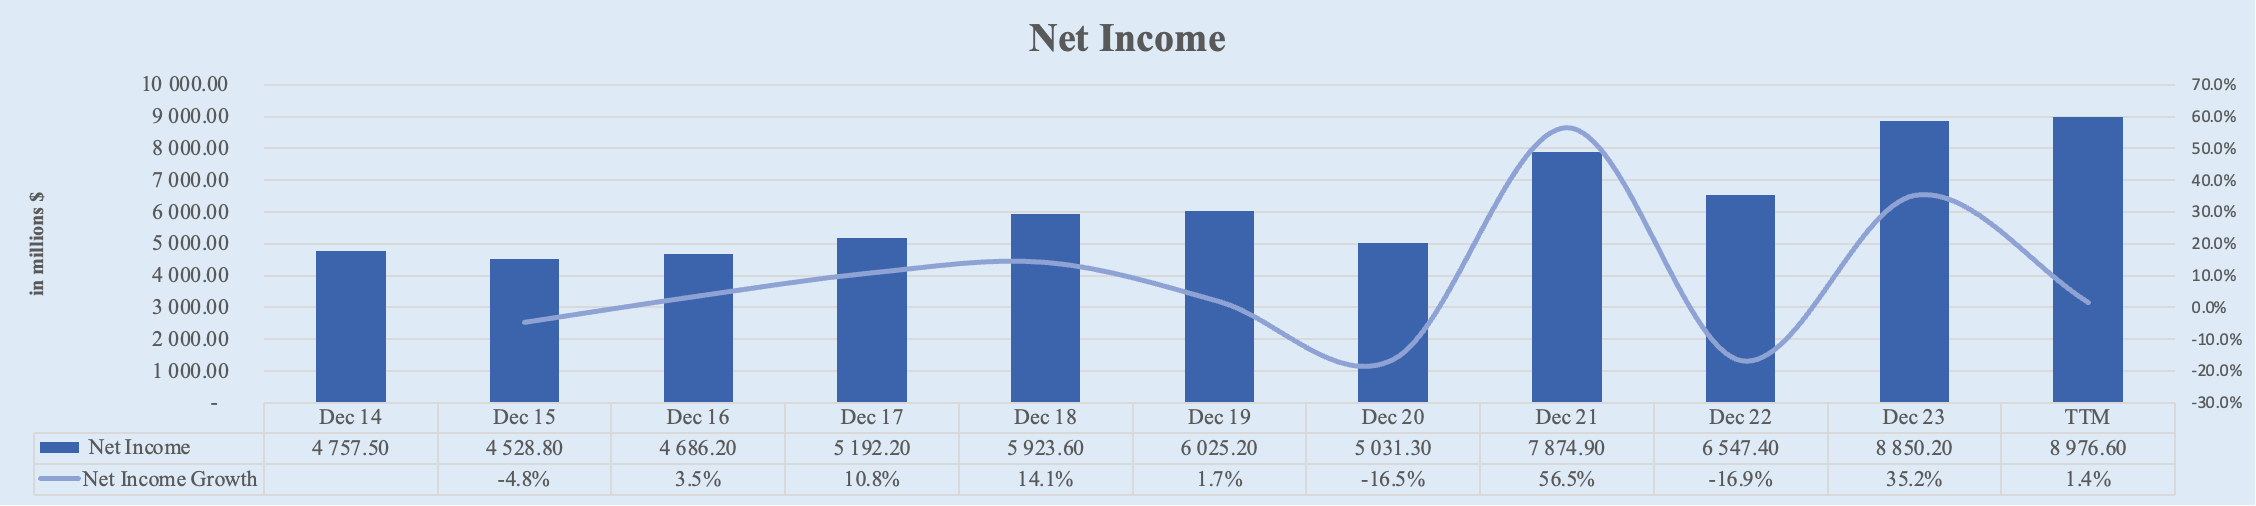
Net Income Growth
McDonald's net income has shown a more positive trend with significant growth in the past decade.
This growth has been driven by strategic initiatives that we saw above such as shift to franchising or the "Accelerating the Arches" strategy.
FY 2014: $4,757.50M
FY 2023: $8,850.20M
TTM: $8,976.60M
1-Year Change: 1.4%
5-Year CAGR: 8.7%
10-Year CAGR: 6.6%
Total Growth: 88.7%
Rating: 3
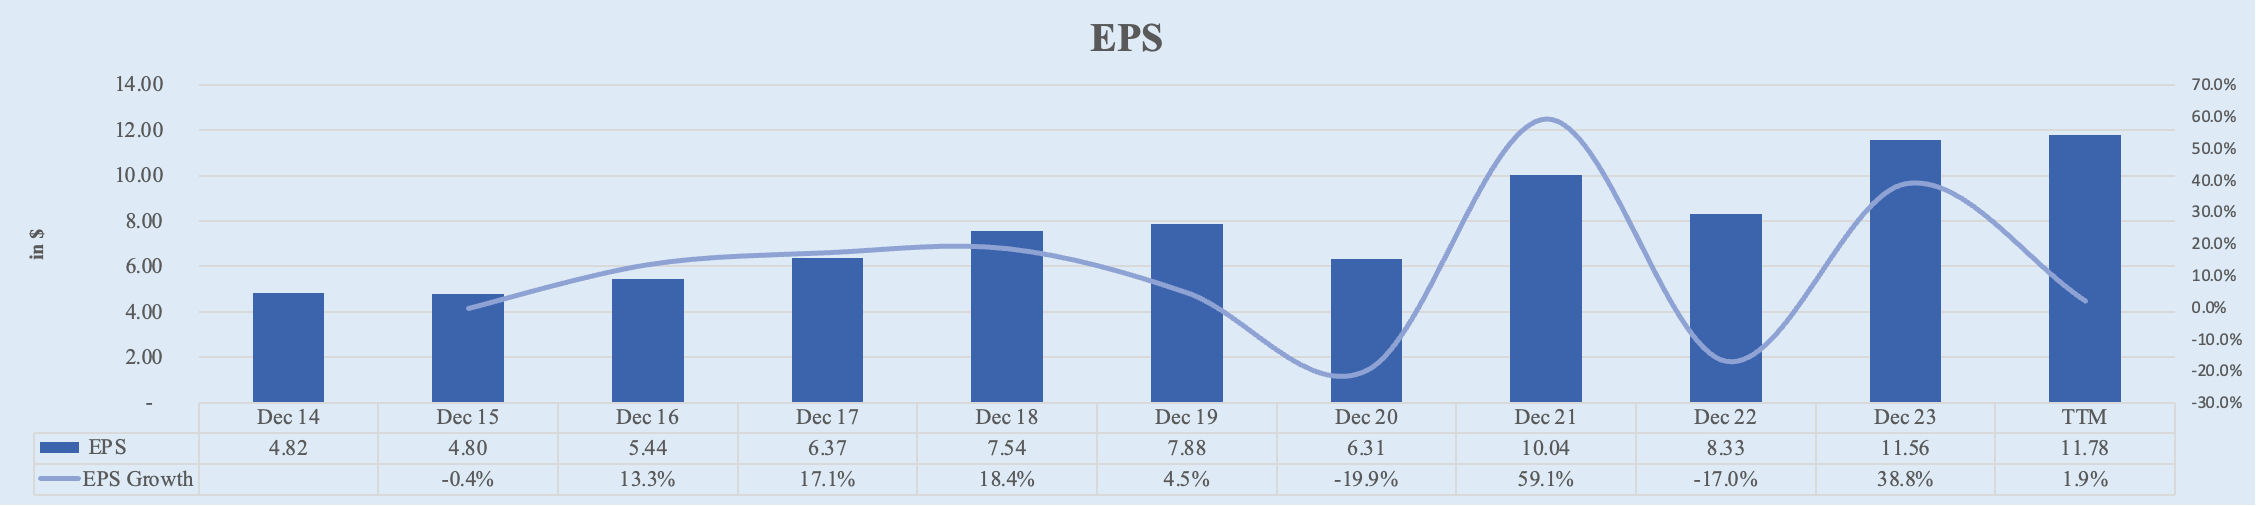
EPS Growth
Such as Net Income, McDonald's EPS have increased significantly over the past decade.
However, the EPS 10-Year CAGR of 9.3% is much higher than the Net Income 10-Year CAGR of 6.6%. This is because McDonald's has aggressively repurchased shares, reducing the number of outstanding shares and thereby amplifying the growth in EPS beyond the net income growth.
FY 2014: $4.82
FY 2023: $11.56
TTM: $11.78
1-Year Change: 1.9%
5-Year CAGR: 9.3%
10-Year CAGR: 9.3%
Total Growth: 144.4%
Rating: 3
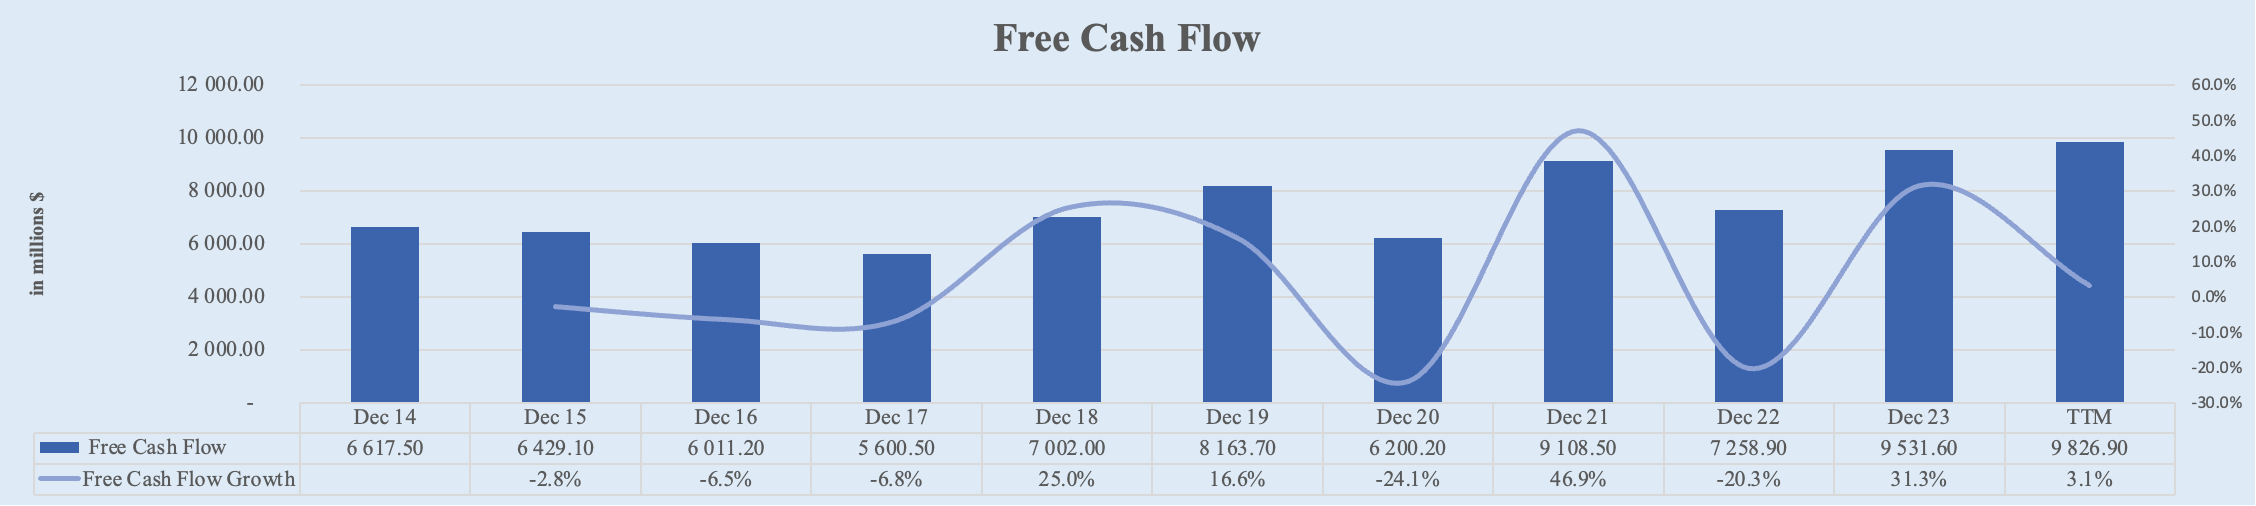
Free Cash Flow Growth
McDonald's free cash flow has grown, though with some fluctuations over the past decade. The shift to a heavily franchised business model has reduced capital expenditure requirements, improving free cash flow generation.
FY 2014: $6,617.50M
FY 2023: $9,531.60M
TTM: $9,826.90M
1-Year Change: 3.1%
5-Year CAGR: 7.0%
10-Year CAGR: 4.0%
Total Growth: 48.5%
Rating: 2
Second Dimension: Profitability 💰
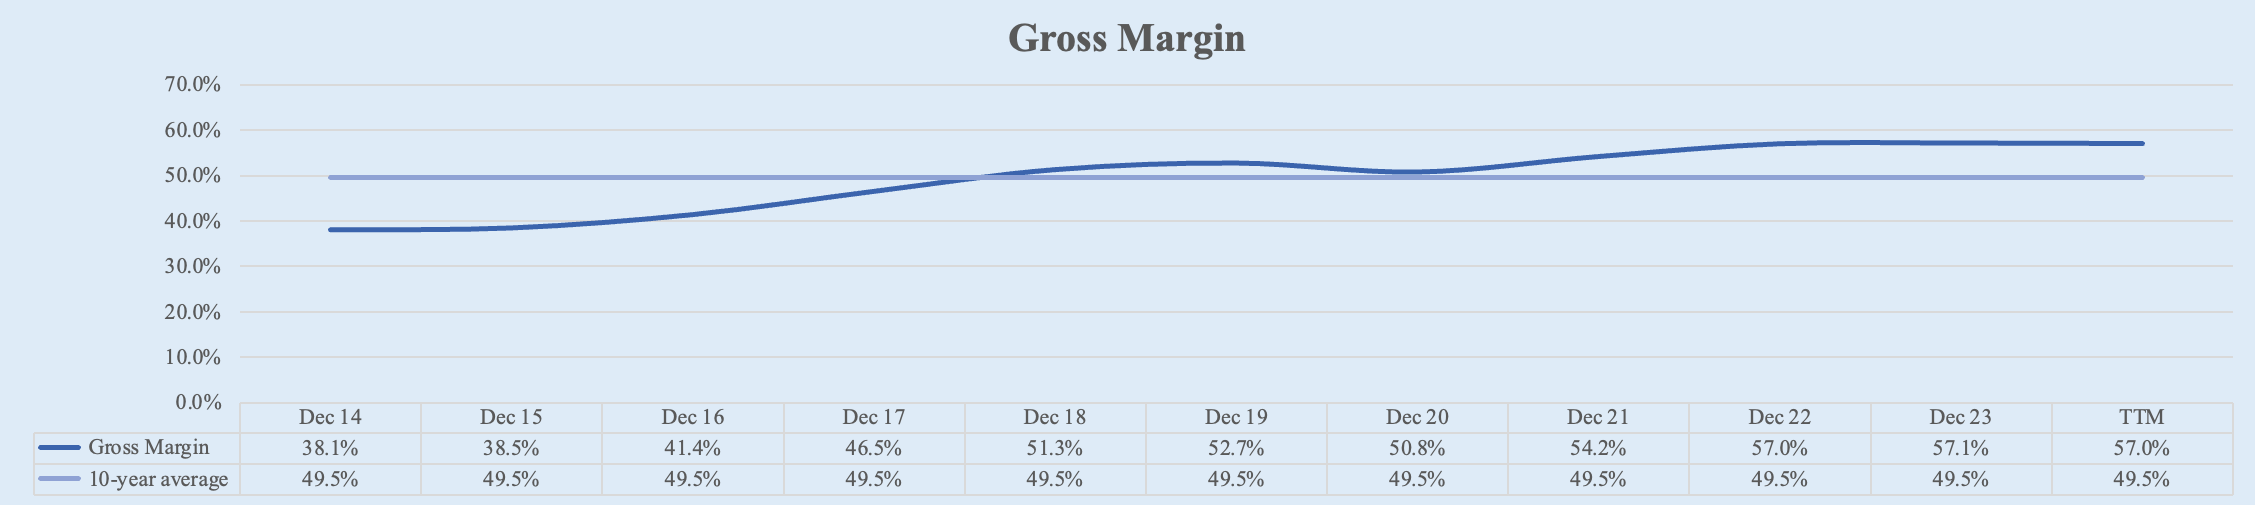
Gross Margin
McDonald's gross margin has improved significantly over the past decade, reflecting the shift to the higher margin franchising business, the Arches strategy, and through better supply chain management and cost control measures.
FY 2014: 38.1%
FY 2023: 57.1%
TTM: 57.0%
10-Year Average: 49.5%
1-Year: 57.0%
5-Year: 54.8%
Rating: 5
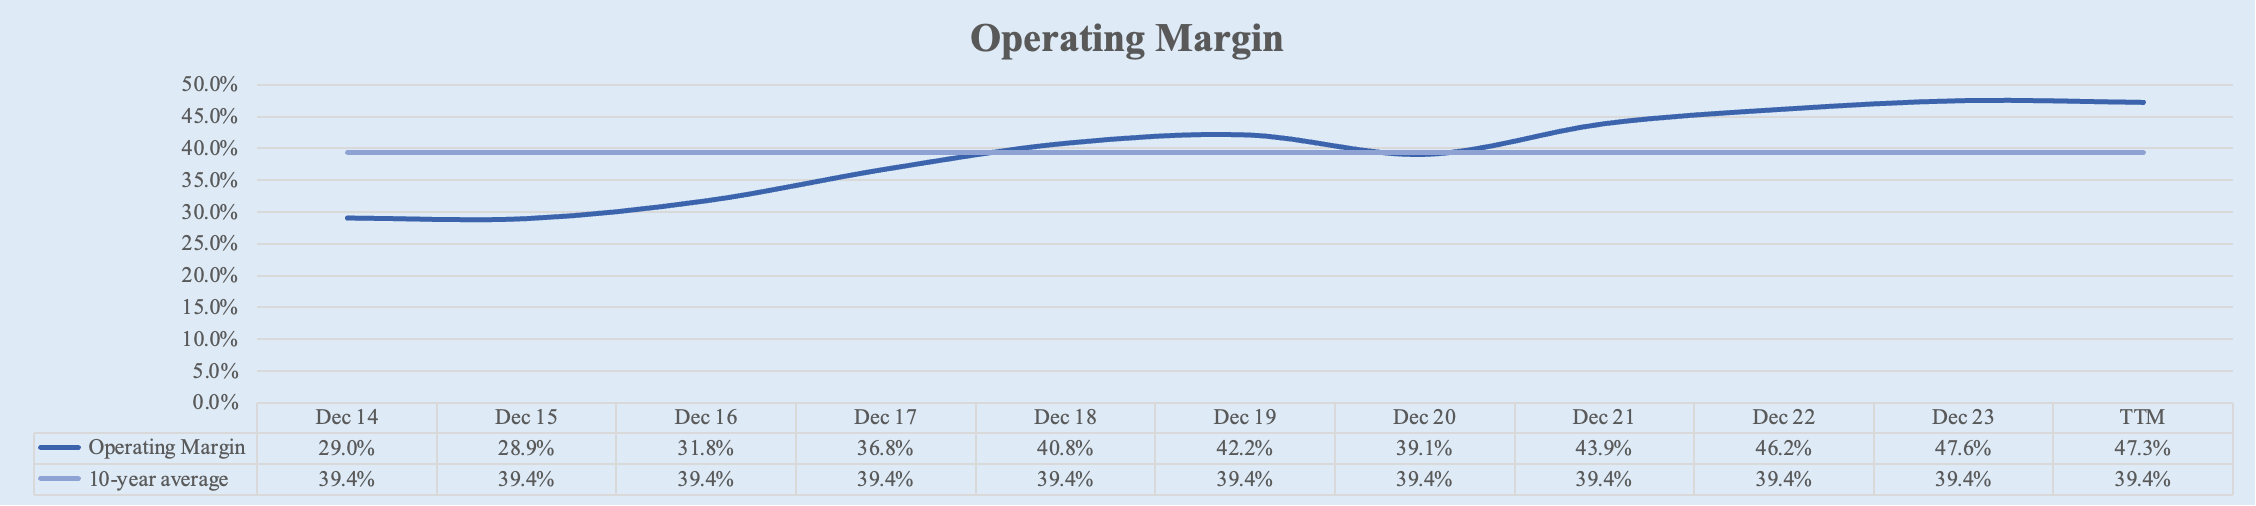
Operating Margin
The operating margin has also seen a significant increase. Starting at 29.0% in FY 2014, it saw a outstanding increase to 47.6% by FY 2023. Recently, over the trailing twelve months (TTM), McDonald’s FCF margin has decreased slightly to 47.3%.
FY 2014: 29.0%
FY 2023: 47.6%
TTM: 47.3%
10-Year Average: 39.4%
1-Year: 47.3%
5-Year: 44.4%
Rating: 5
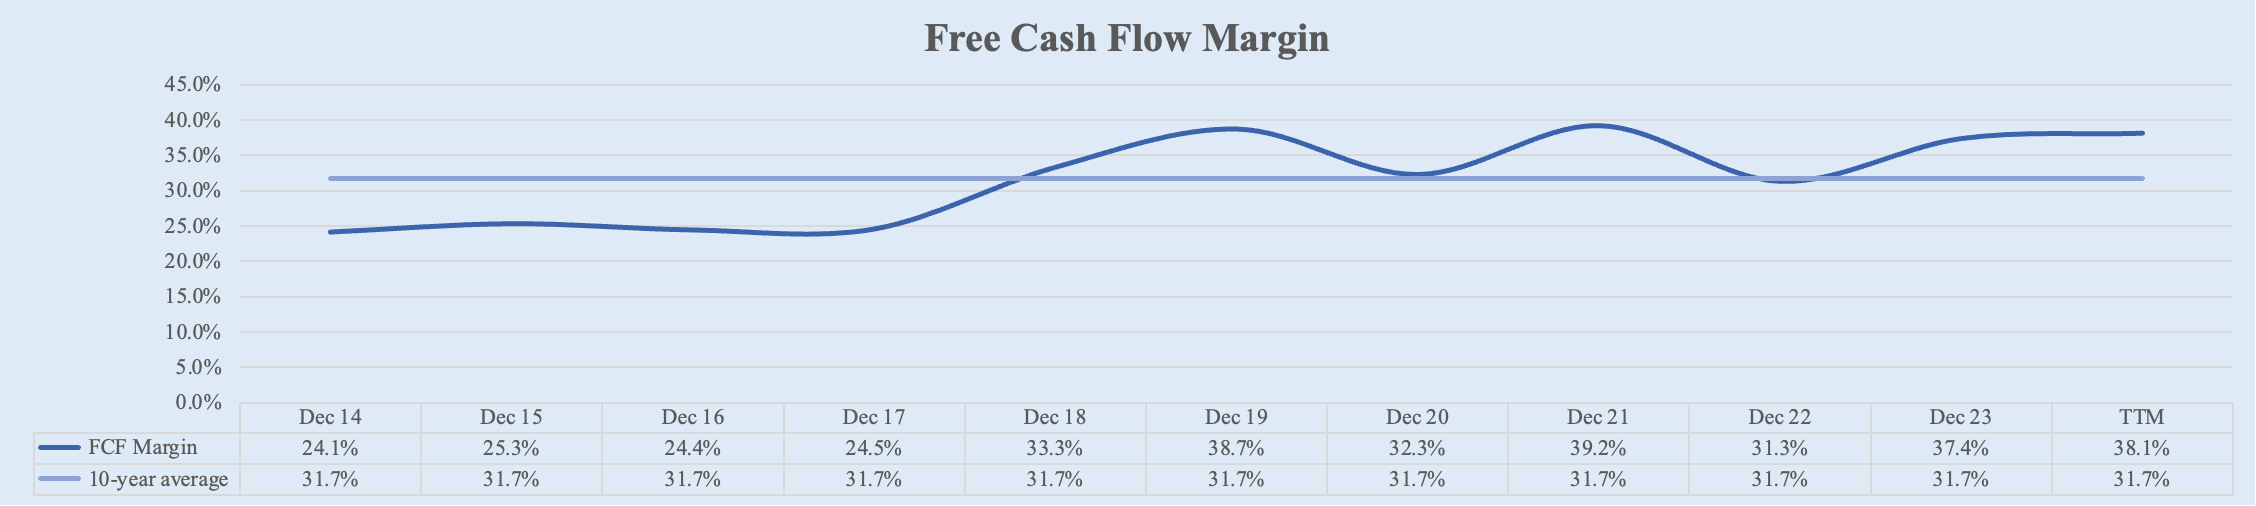
FCF Margin
McDonald's free cash flow margin has also shown consistent growth.
FY 2014: 24.1%
FY 2023: 37.4%
TTM: 38.1%
10-Year Average: 31.7%
1-Year: 38.1%
5-Year: 36.2%
Rating: 5
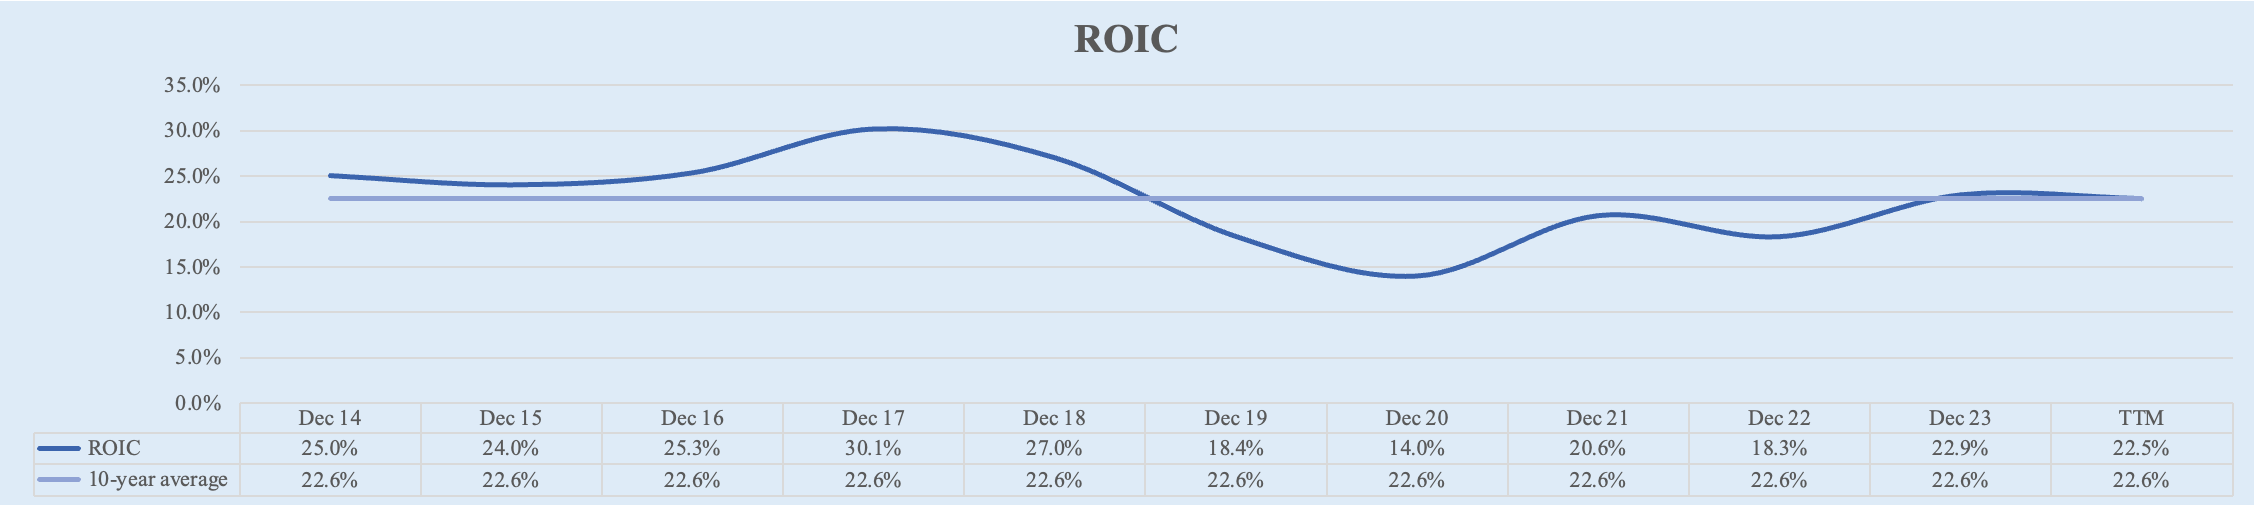
ROIC
The final metric in this Second Dimension is the return on invested capital (ROIC). Although the current ROIC stands at 22.5%, which is slightly lower than the 25.0% recorded a decade ago, it still indicates a robust profitability.
FY 2014: 25.0%
FY 2023: 22.9%
TTM: 22.5%
10-Year Average: 22.6%
1-Year: 22.5%
5-Year: 19.5%
Rating: 3
McDonald's has experienced a notable increase in profitability due to several strategic initiatives and market adaptations:
Accelerating the Arches Strategy: As shown above, this comprehensive strategy focuses on enhancing customer experiences through digital transformation, menu innovation, and operational efficiencies. Key components include expanding digital and delivery services, improving core menu items, and optimizing drive-thru operations. These initiatives have driven higher sales and improved margins.
Digital and Delivery Expansion: Investments in the McDonald's mobile app, partnerships with third-party delivery services, and enhancements to the drive-thru experience have significantly boosted digital sales. Digital channels have become a major revenue stream, contributing to the overall increase in profitability.
Cost Leadership and Market Penetration: McDonald's continues to leverage its cost leadership strategy, offering competitive prices that attract a broad customer base. This strategy, combined with market penetration efforts, such as franchising and joint ventures, has helped McDonald's expand its market reach and increase sales.
Franchising Model: The shift to a heavily franchised business model has reduced operational costs and increased profitability. By franchising more locations, McDonald's has transferred capital expenditures to franchisees, which has improved margins and allowed the company to focus on strategic growth initiatives.
Third Dimension: Solvency 💸
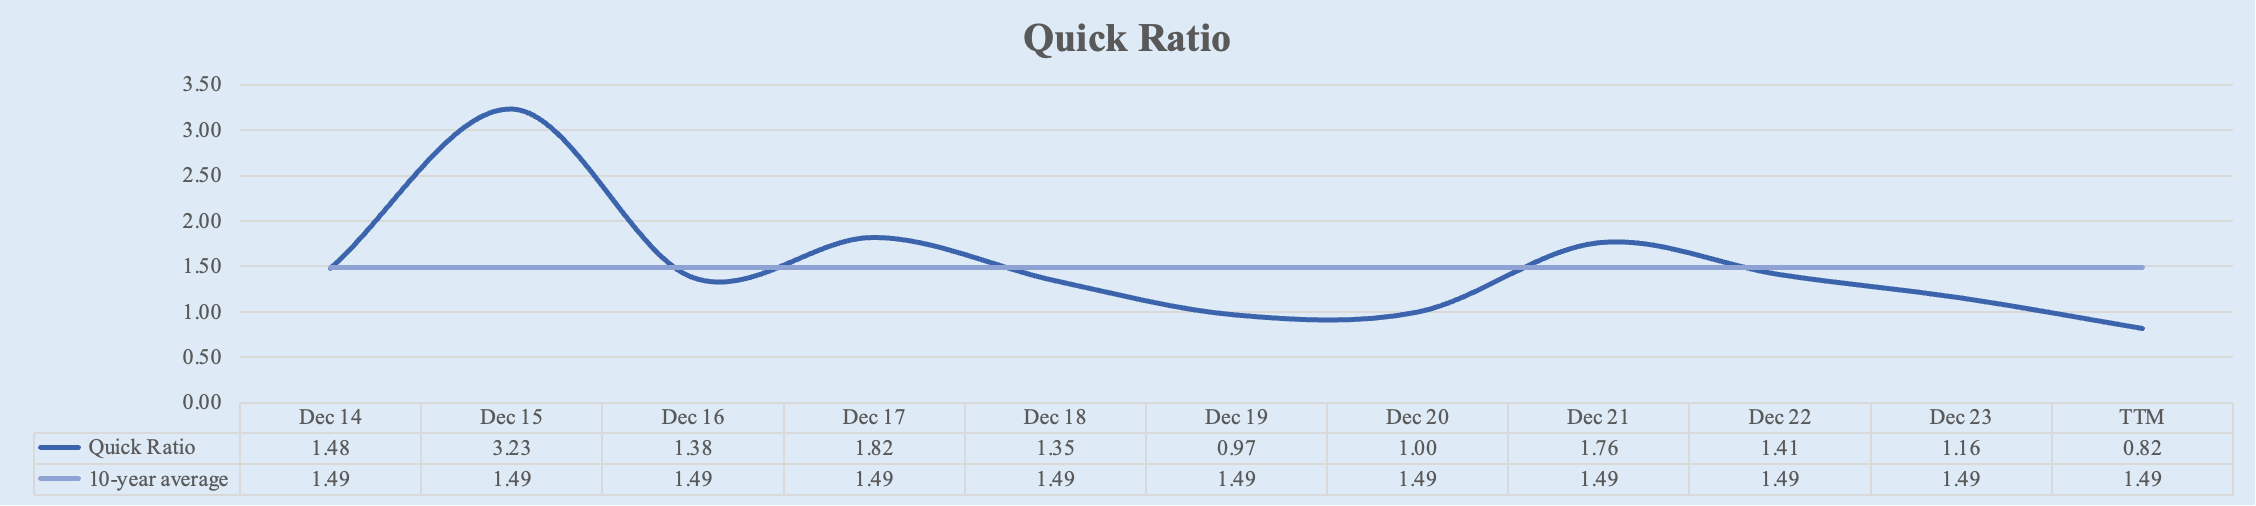
Quick Ratio
The quick ratio has been declining, and the most recent figure is below the optimal level. Ideally, we aim for quick ratios above 1, which indicates that current assets exceed current liabilities.
FY 2014: 1.48
FY 2023: 1.16
TTM: 0.82
10-Year Average: 1.49
1-Year: 0.82
5-Year: 1.19
Rating: 2
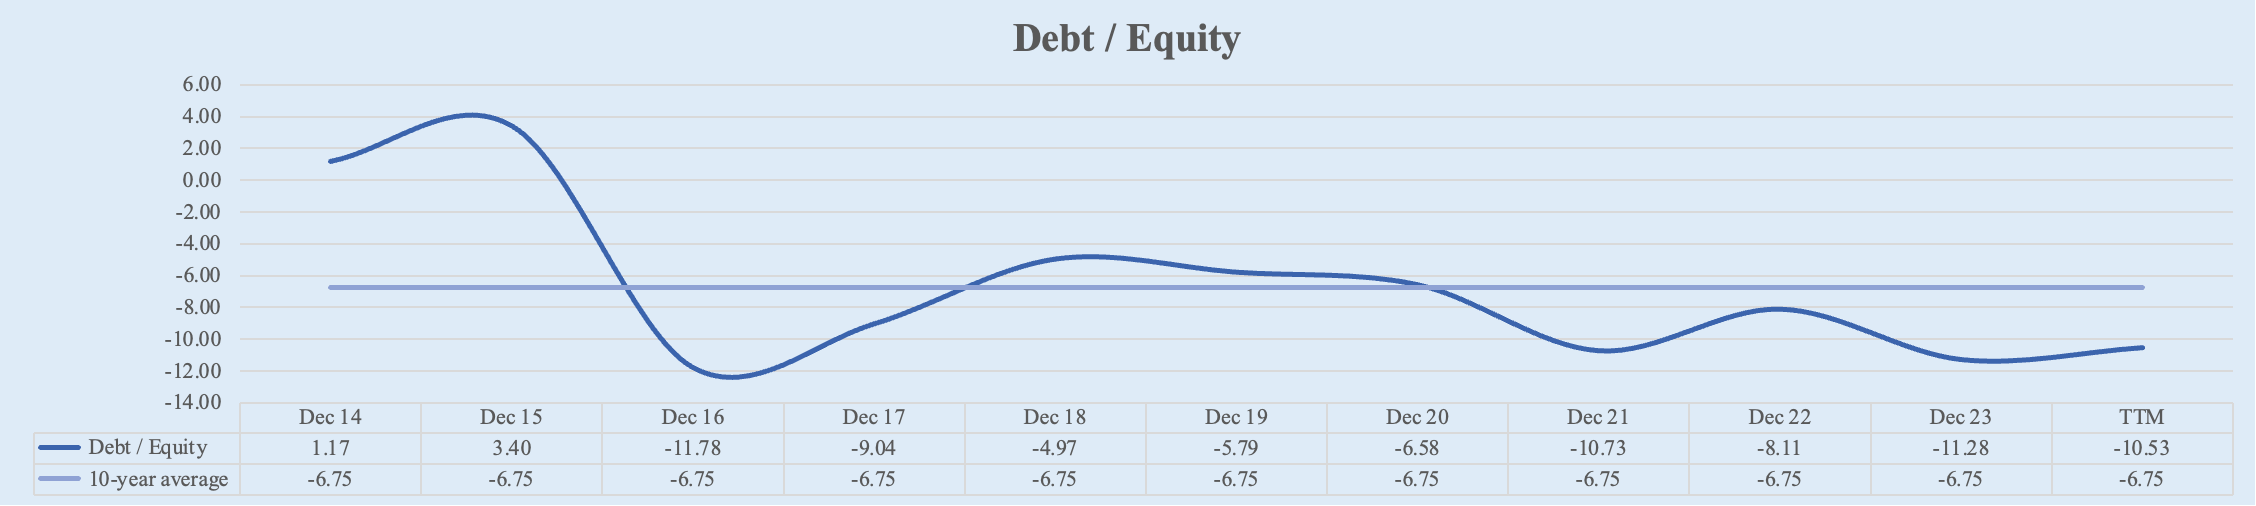
Debt / Equity
The debt to equity ratio turned negative from 2016 onwards because McDonald's equity became negative.
This shift resulted from substantial stock buybacks, which reduce the company’s equity. When a company buys back its shares, the cost of the repurchased shares is deducted from shareholders' equity and recorded in the treasury stock account, a contra-equity account. This reduces total equity but is not considered an asset.
Consequently, stock buybacks affect several financial ratios:
1. EPS Increase: Reducing the number of shares outstanding increases earnings per share (EPS) since EPS = Net Income / Shares Outstanding.
2. Return on Equity (ROE): ROE may increase as both net income and equity decrease, potentially by different amounts.
3. Debt to Equity Ratio: This ratio increases (or turns negative) because equity decreases while debt remains unchanged, potentially signaling higher financial leverage.
FY 2014: 1.17
FY 2023: -11.28
TTM: -10.53
10-Year Average: -6.75
1-Year: -10.53
5-Year: -8.84
Rating: 1
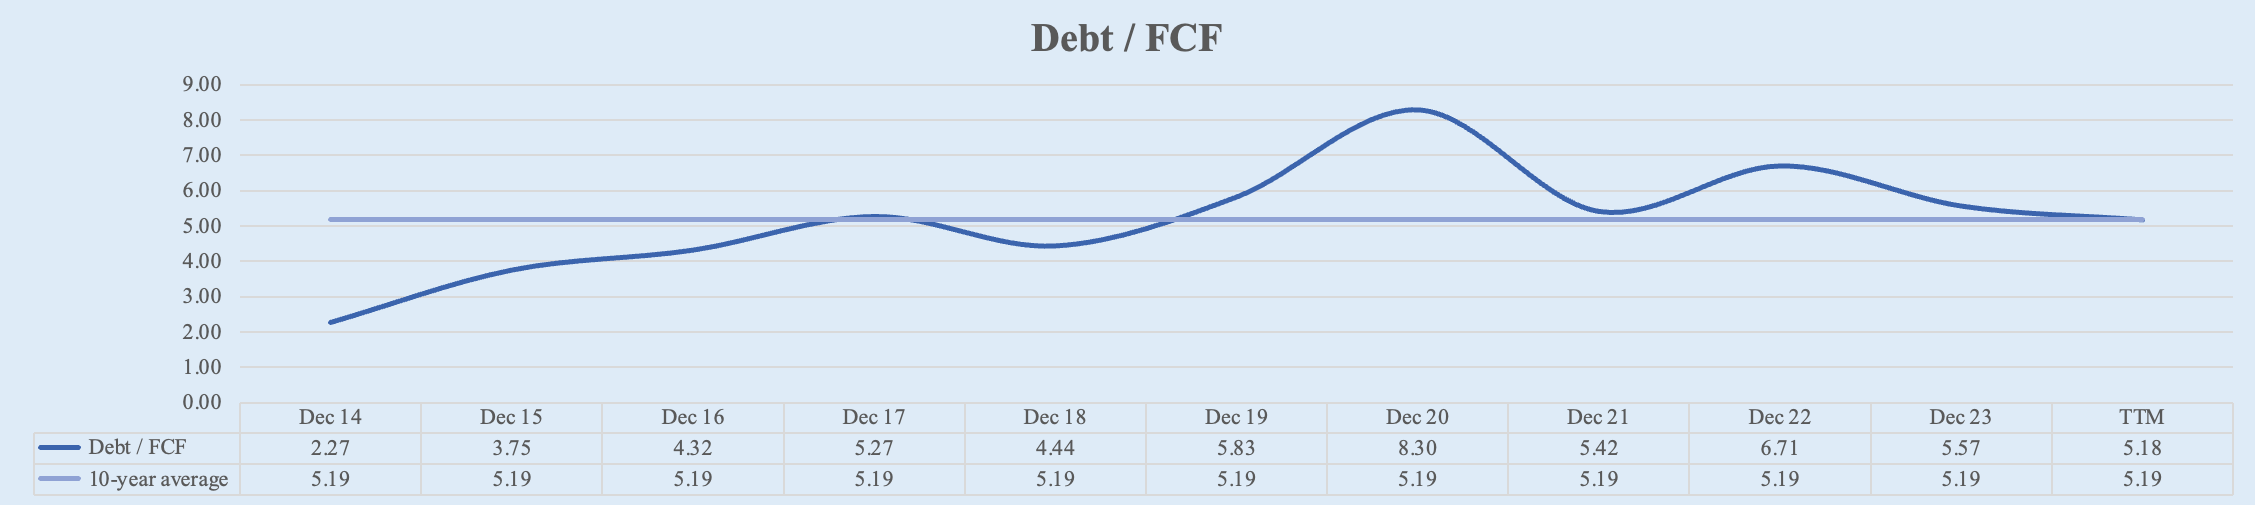
Debt / FCF
The debt to free cash flow ratio has significantly increased, indicating that McDonald's now takes more time to pay off its debt using its annual cash flows.
In 2014, McDonald's could pay off all its debt with the cash flows generated in just 2.27 years. Today, it would take 5.57 years to achieve the same, more than double the previous duration.
This change is due to the increase in McDonald's debt from approximately $15 billion in 2014 to $50.8 billion today. Ideally, businesses should aim to keep this ratio below 5.
FY 2014: 2.27
FY 2023: 5.57
TTM: 5.18
10-Year Average: 5.19
1-Year: 5.18
5-Year: 6.17
Rating: 2
Fourth Dimension: Valuation 📈
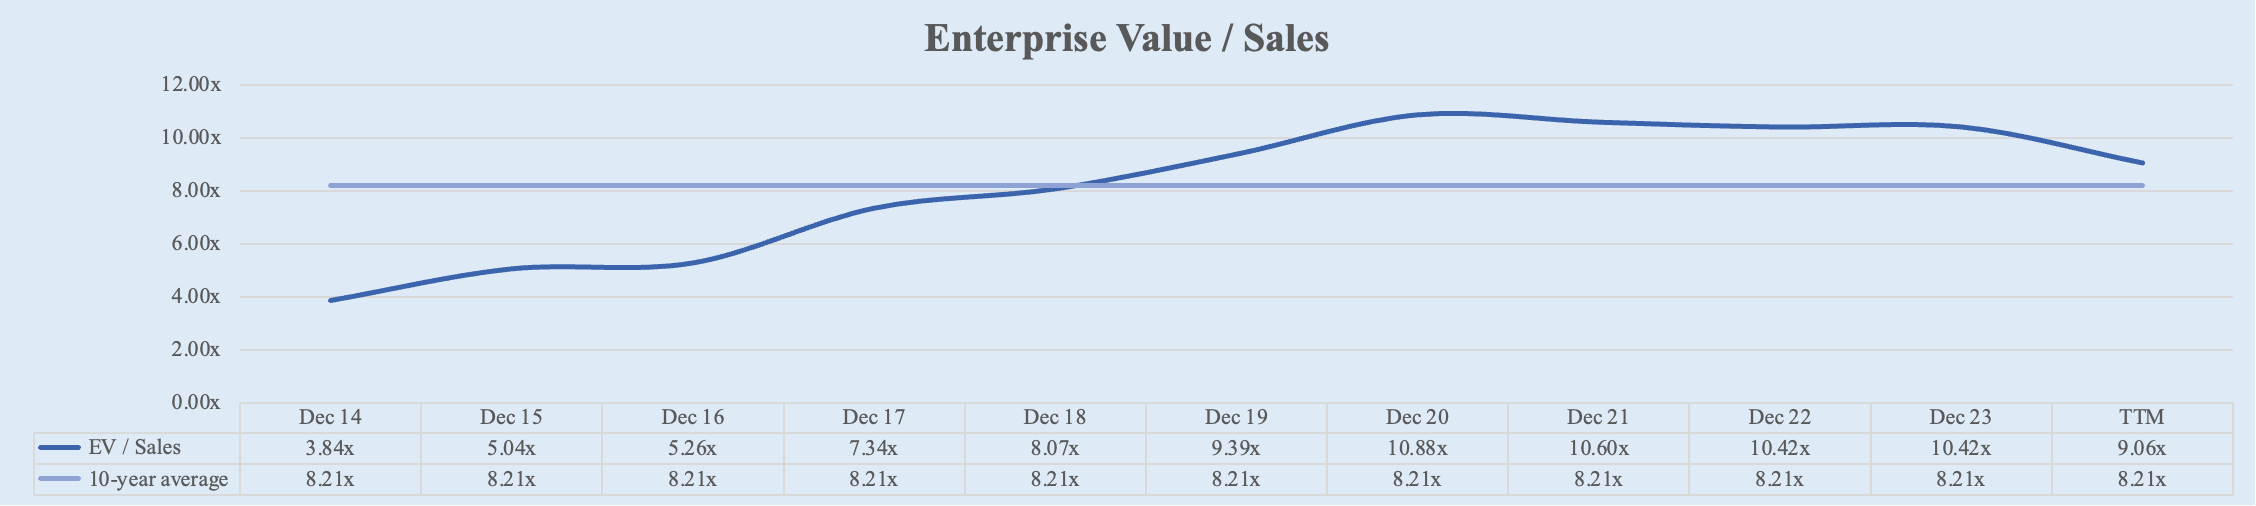
EV / Sales
The EV/Sales ratio for McDonald's has increased significantly over the past decade, peaking at 10.88x in 2020 and settling at 9.06x today. This is substantially higher than the 3.84x ratio recorded in 2014.
This rise reflects the higher profitability McDonald’s has achieved and the successful business turnaround the company has undergone. The strategic shift towards franchising, enhanced digital and delivery services, and continuous menu innovation have all contributed to this improved financial performance and investor confidence.
FY 2014: 3.84x
FY 2023: 10.42x
TTM: 9.02x
10-Year Average: 8.21x
1-Year: 9.02x
5-Year: 10.12x
Rating: 3
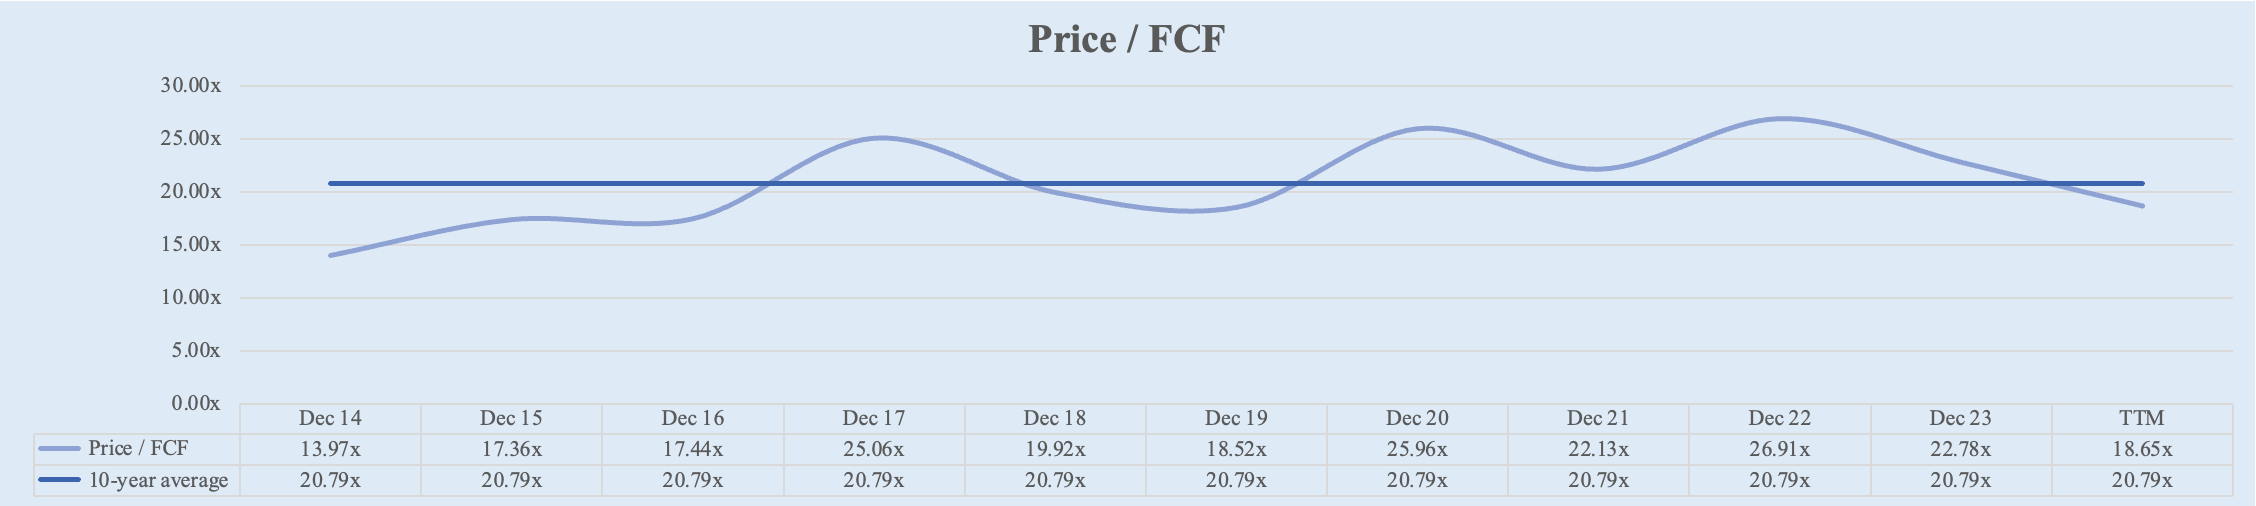
Price / FCF
The Price/FCF multiple for McDonald's has also increased, currently at 18.57x compared to 13.97x in 2014. However, this increase is less pronounced than the rise in the EV/Sales multiple. Additionally, the current Price/FCF multiple is actually below the 10-year average of 20.78x, indicating a relatively more moderate valuation expansion in this metric.
This trend makes sense given that McDonald’s revenue has remained relatively flat over the past decade, while free cash flow has increased by nearly 50% during the same period.
FY 2014: 13.97x
FY 2023: 22.78x
TTM: 18.57x
10-Year Average: 20.78x
1-Year: 18.57x
5-Year: 22.48x
Rating: 4
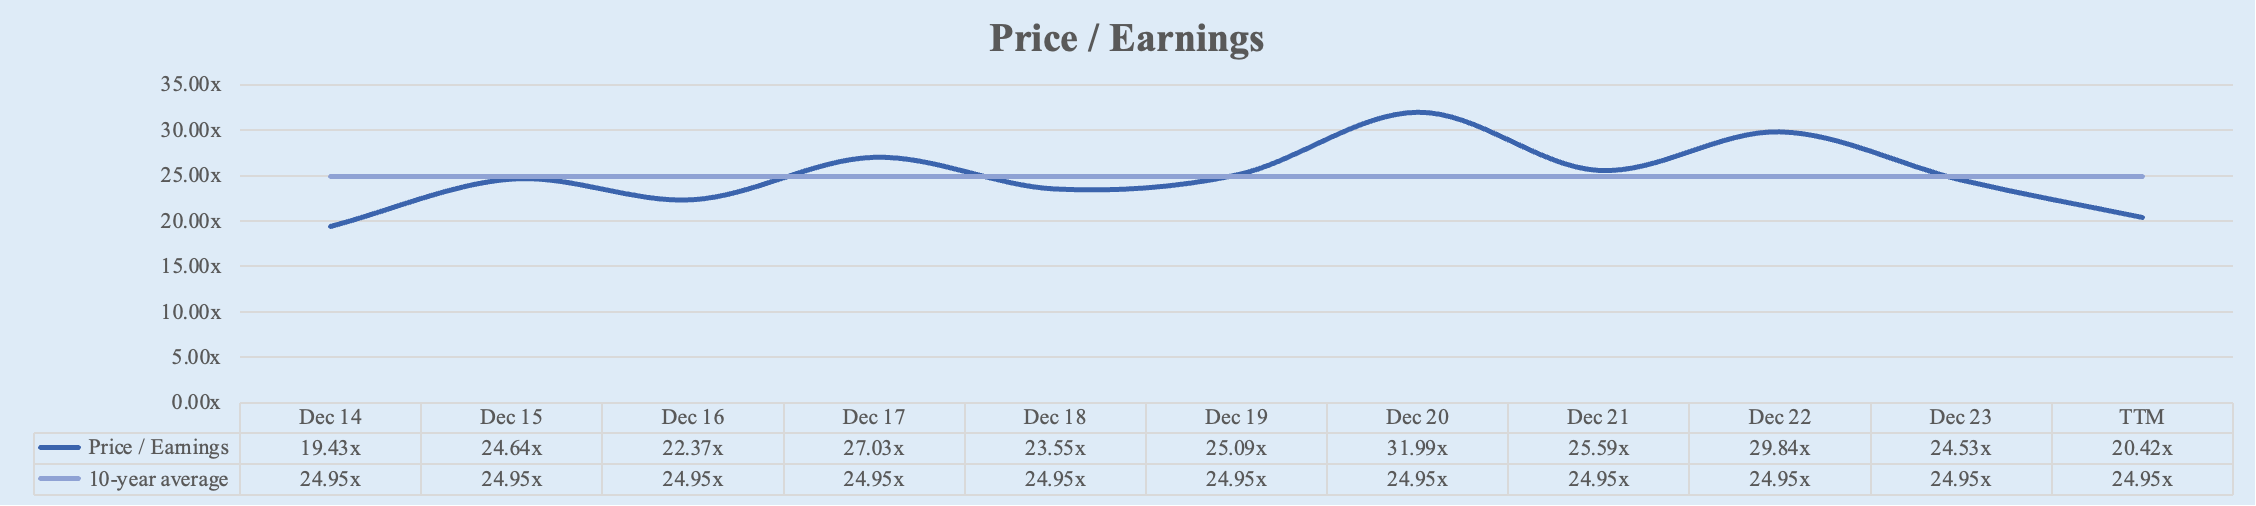
Price / Earnings
The most favorable valuation multiple is the Price/Earnings (P/E) ratio. The current P/E multiple of 20.33x closely aligns with the 19.43x seen in 2014. In the remaining years, the P/E ratio has not been this low.
Which also makes sense, the higher growth was seen in McDonald’s net income. Net income grew a total of 88.7% whilst FCF only grew nearly 50%.
FY 2014: 19.43x
FY 2023: 24.53x
TTM: 20.33x
10-Year Average: 24.94x
1-Year: 20.33x
5-Year: 26.23x
Rating: 5
Fifth Dimension: Shareholders Return 💵
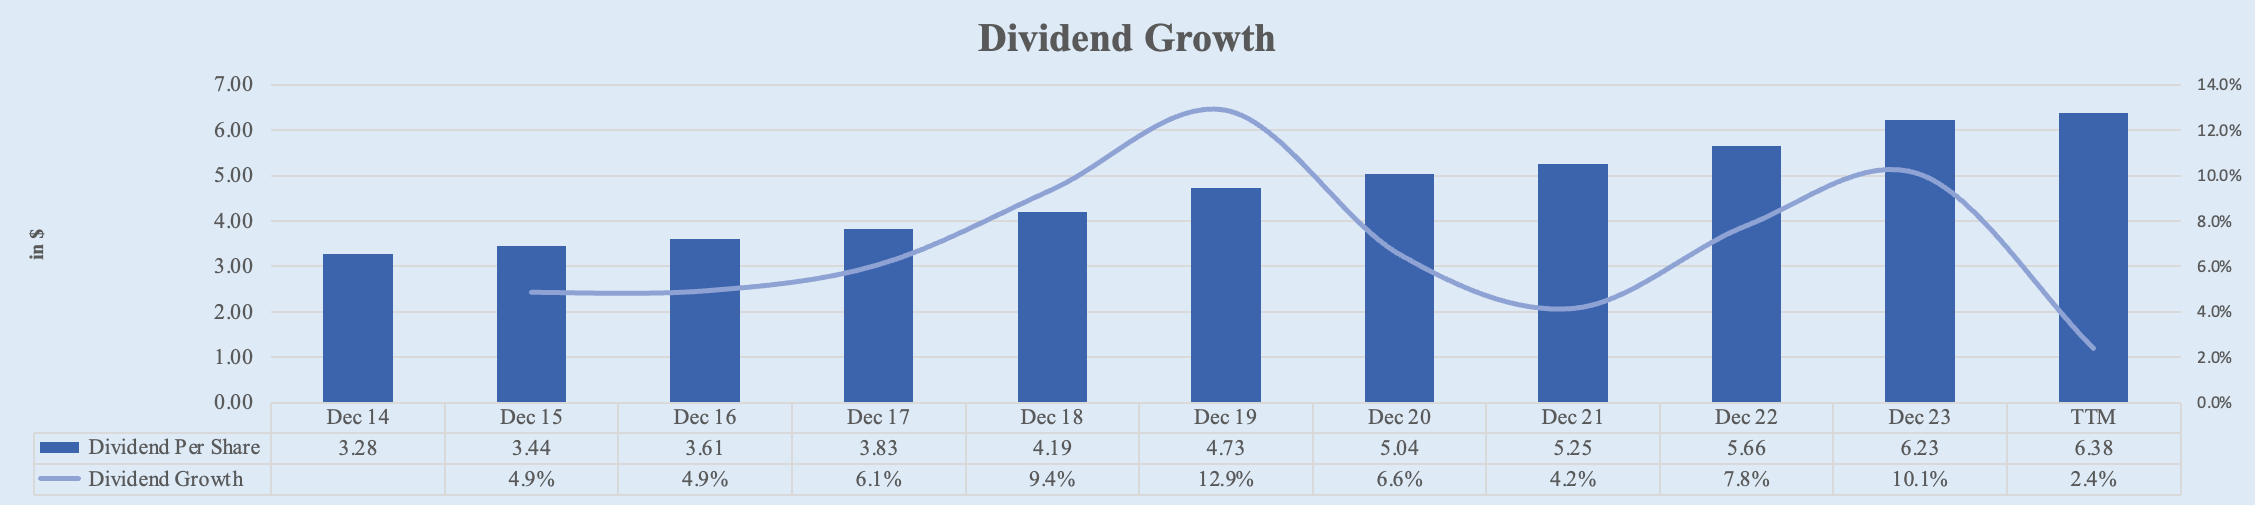
Dividend Growth
McDonald's dividends have exhibited robust growth over the past decade. Beginning at $3.28 per share in FY 2014, dividends have almost doubled to the current $6.23 per share. This translates to a 5-year CAGR of 8.8% and a 10-year CAGR of 6.9%, the kind of growth that every dividend investor wants.
FY 2014: $3.28
FY 2023: $6.23
TTM: $6.38
1-Year Growth: 2.4%
5-Year CAGR: 8.8%
10-Year CAGR: 6.9%
Total Growth: 94.5%
Rating: 4
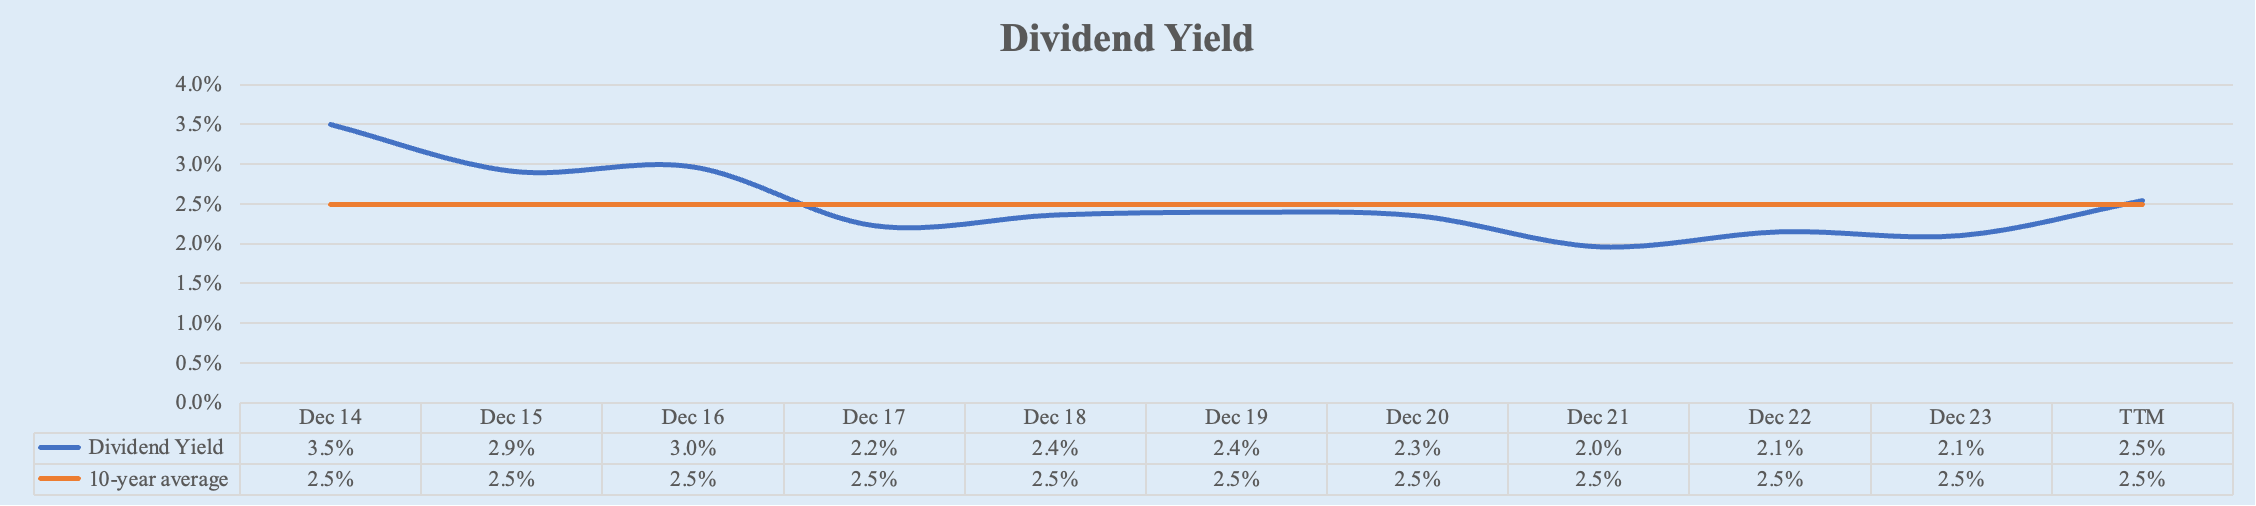
Dividend Yield
Dividend yield has remained stable over the recent years, but we haven’t seen a yield so high since 2016 when it ended the year with a 3.0% yield.
FY 2014: 2.5%
FY 2023: 2.5%
TTM: 2.7%
10-Year Average: 2.5%
1-Year: 2.7%
5-Year: 2.3%
Rating: 4
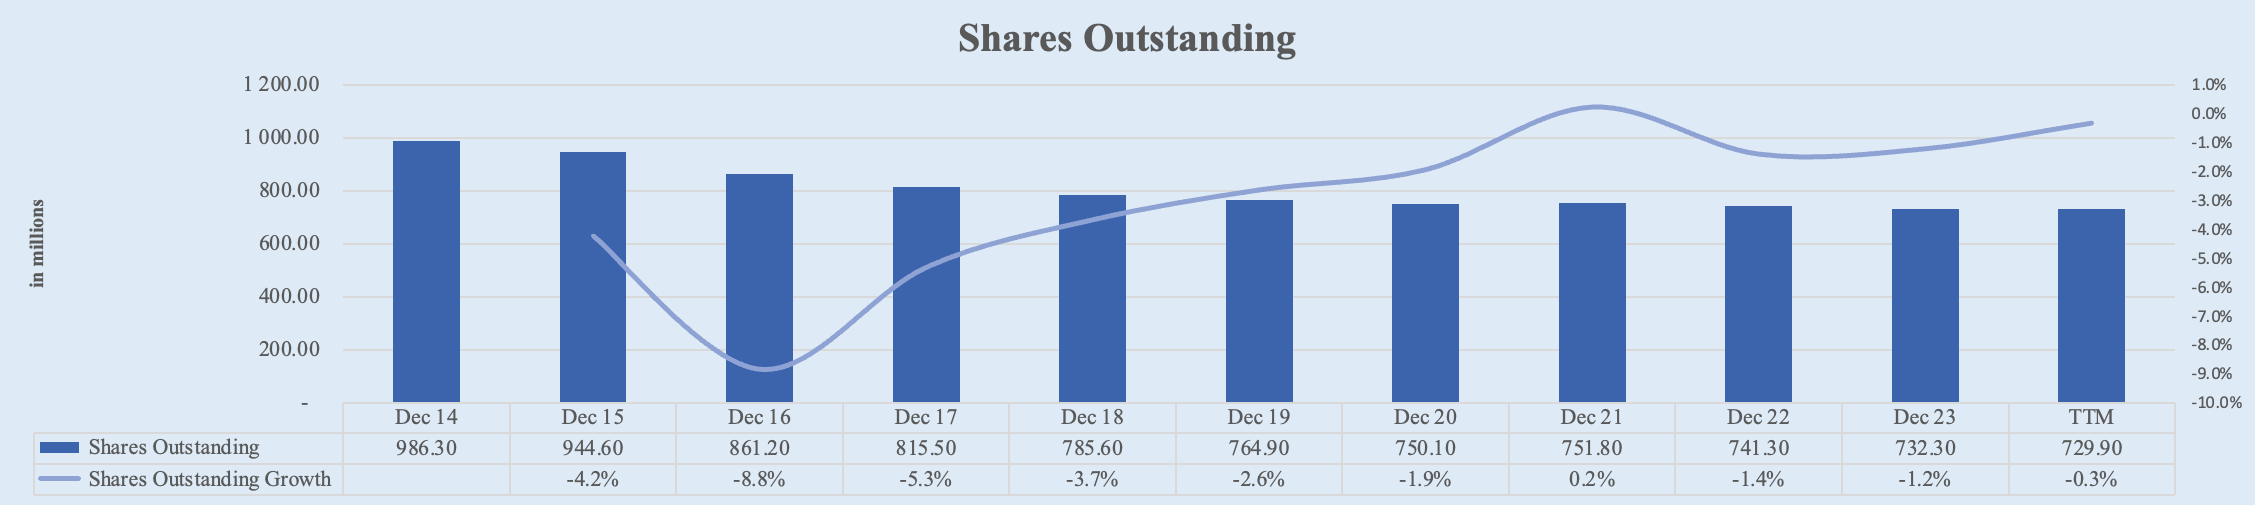
Shares Outstanding
Now onto one of the most important metrics: McDonald's shares outstanding have significantly decreased over the past decade. Starting from 986.30M shares in FY 2014, the number of shares decreased to 732.30M million in FY 2023. Over the LTM, McDonald’s shares outstanding further decreased to 729.90M.
This represents a 5-year CAGR of -0.9% and a 10-year CAGR of -3.0%. Just look at the magnitude of this: McDonald’s bought back more than 1/4 of the shares outstanding over this past decade. That’s remarkable! However, we have to note that the magnitude of these buybacks have been decreasing in recent years.
FY 2014: 986.30M
FY 2023: 732.30M
TTM: 729.90M
1-Year Change: -0.3%
5-Year CAGR: 0.0%
10-Year CAGR: 0.0%
Rating: 5
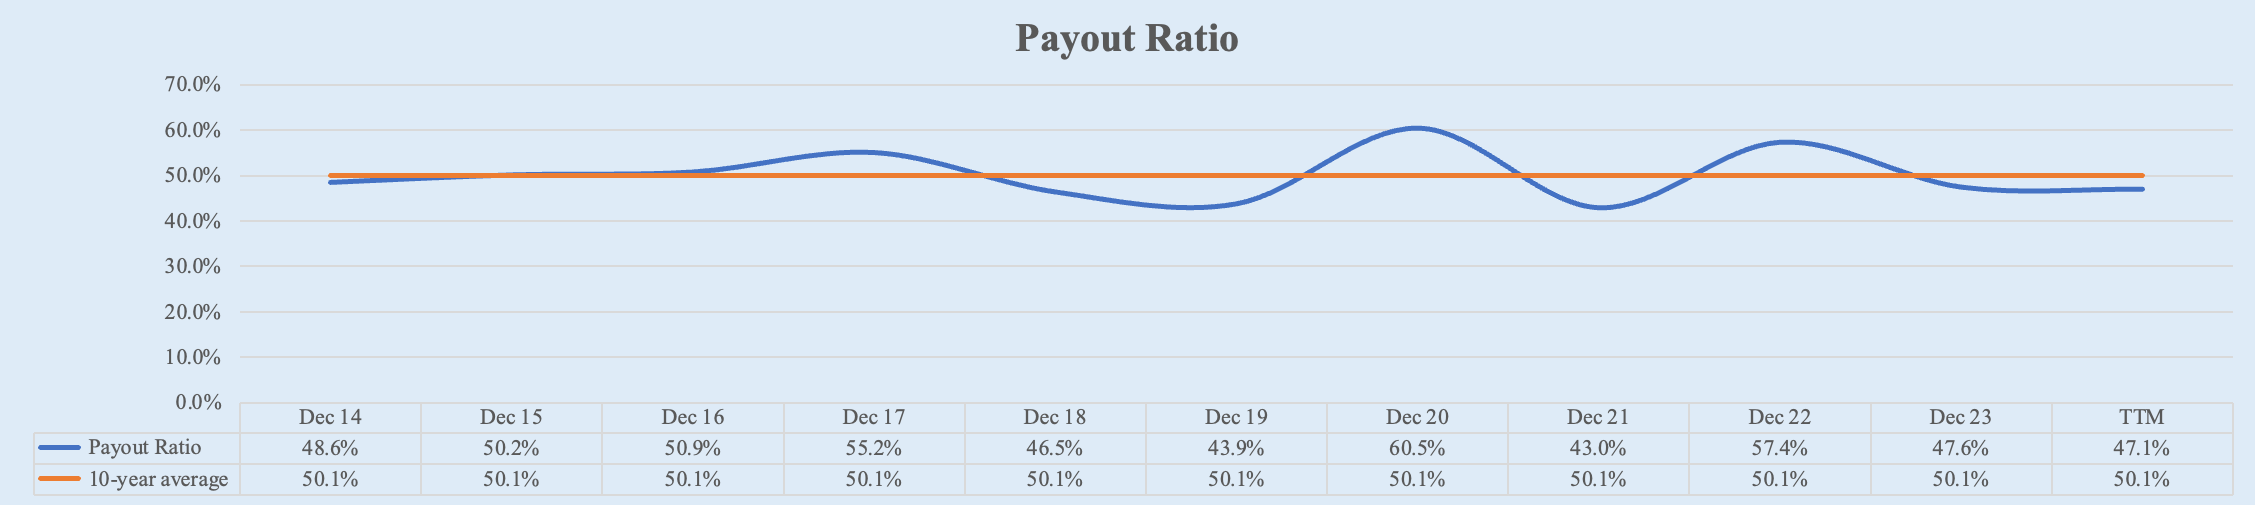
Payout Ratio
The payout ratio has remained relatively stable.
FY 2014: 48.6%
FY 2023: 47.6%
TTM: 47.1%
5-Year Average: 49.9%
10-Year Average: 50.1%
Rating: 4
Five Dimensions Summary
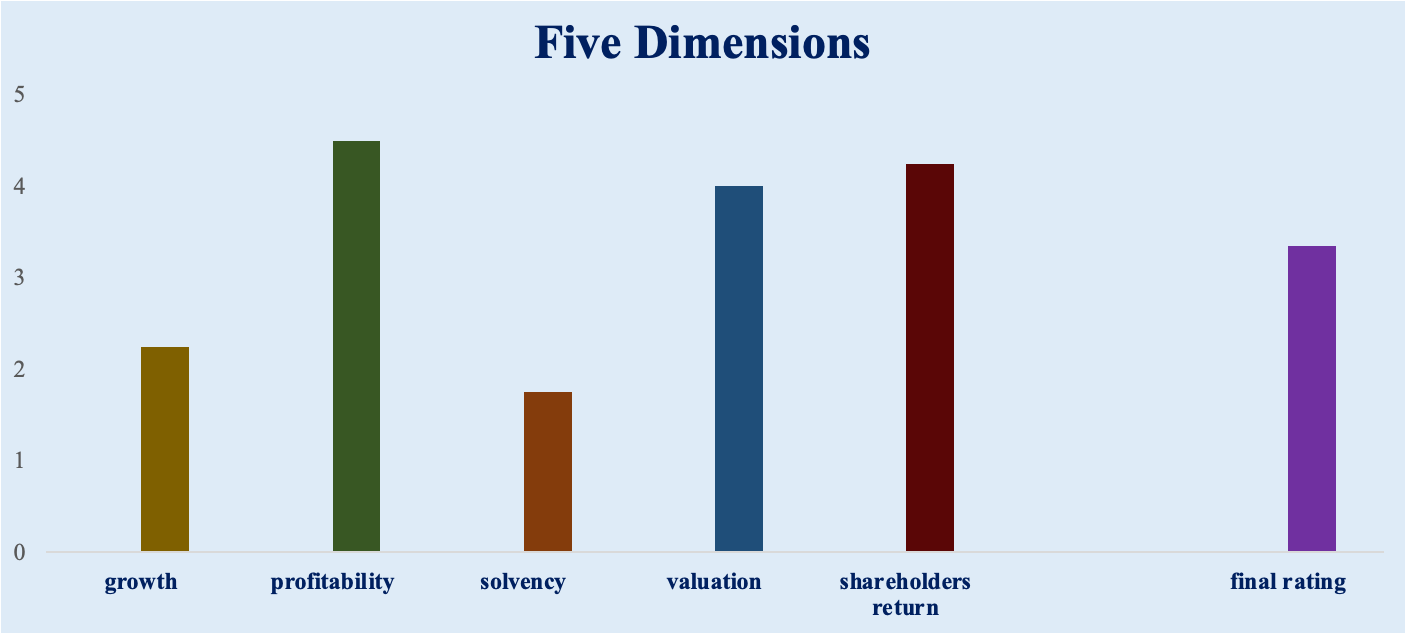
Growth: 2.3
Profitability: 4.5
Solvency: 1.8
Valuation: 4.0
Shareholders Return: 4.3
Final Rating: 3.4
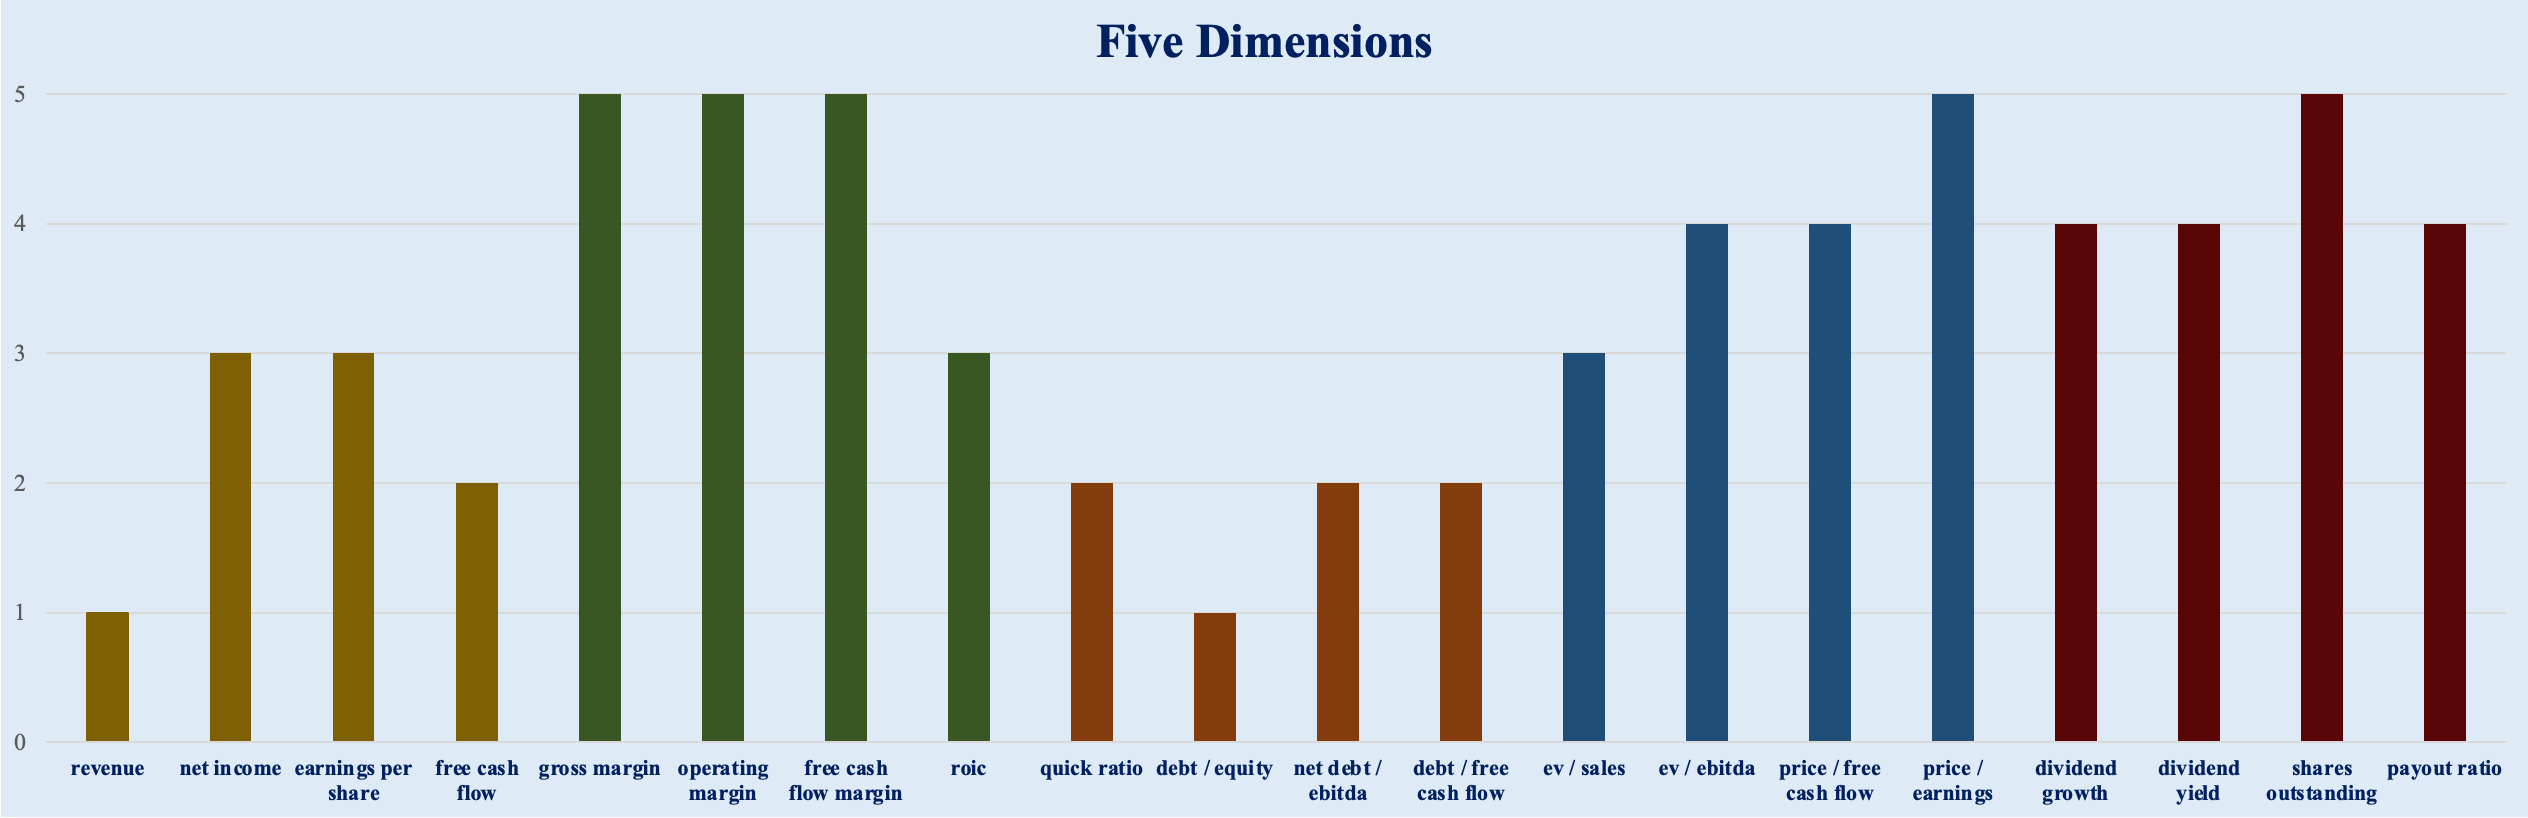
Positive Metrics:
Gross Margin, Operating Margin, FCF Margin (Ratings: 5): Huge growth in margins.
Price / Earnings (Rating: 5): Lowest multiple since 2014.
Dividend Growth (Rating: 4): Great increase in dividends.
Shares Outstanding (Rating: 5): More than 1/4 reduction in share count.
Negative Metrics:
Revenue Growth (Rating: 1): Revenue decrease.
Debt / Equity (Rating: 1): Negative equity.
Quick Ratio, Net Debt / EBITDA, Debt / FCF (Ratings: 2): Increased leverage and increased debt.
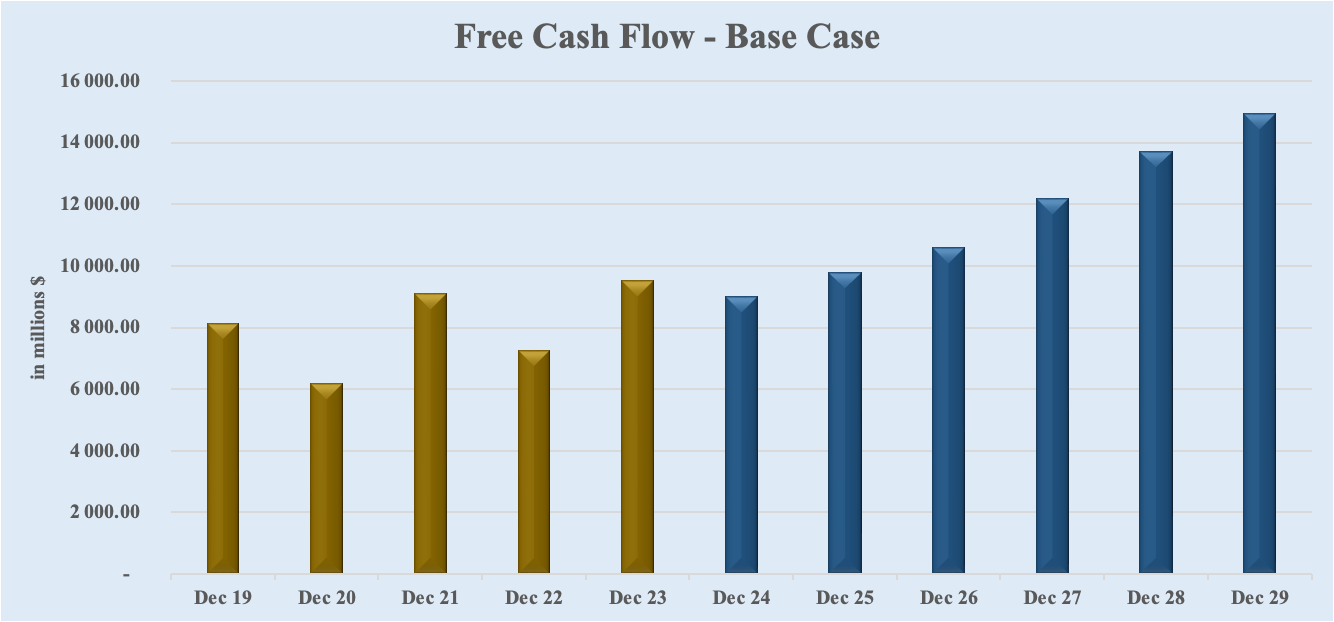
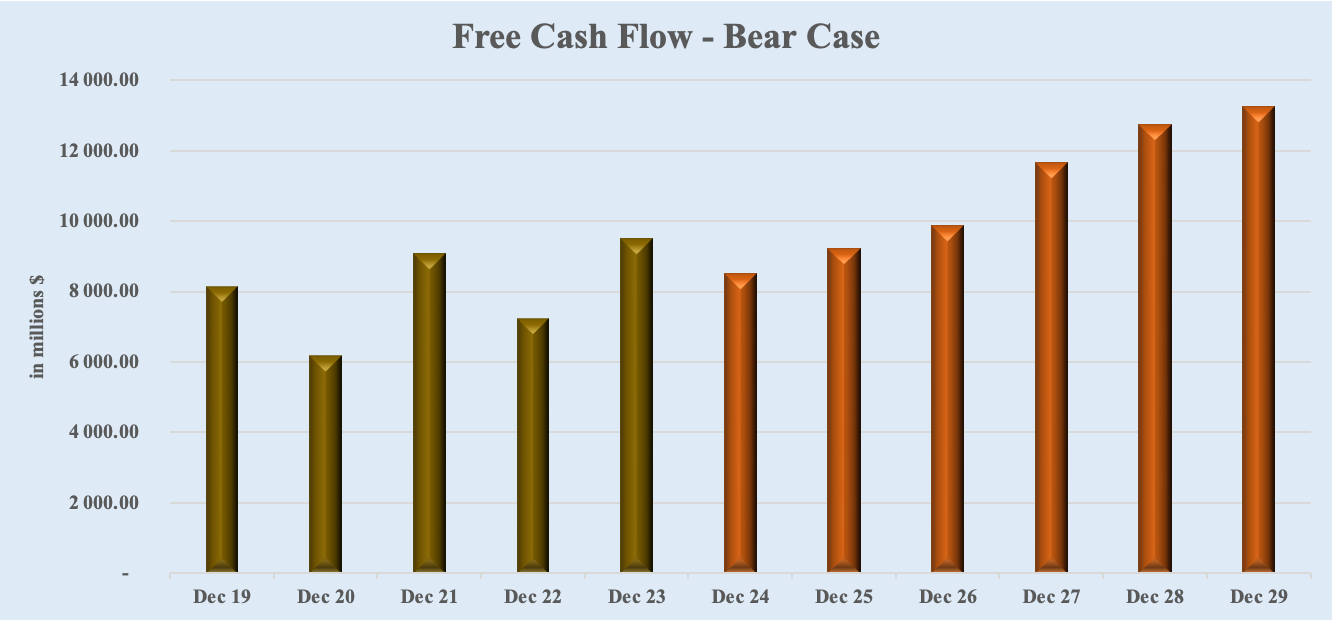
II. DCF Valuation
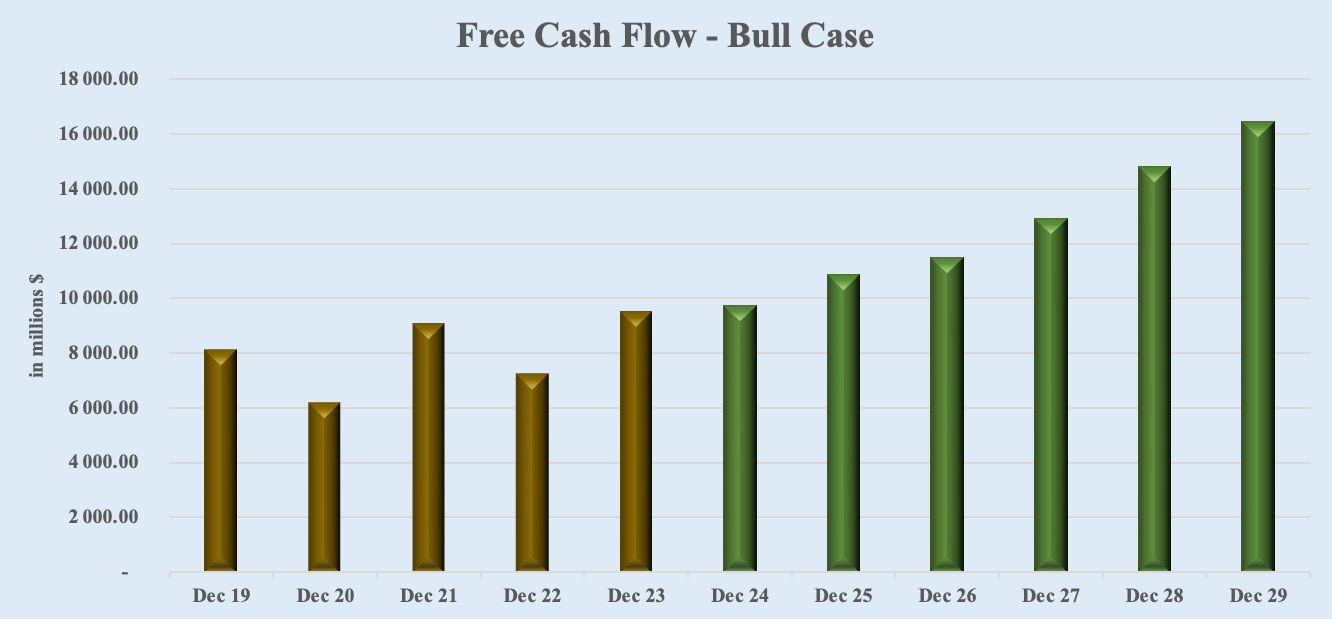
I employ Wall Street analysts' free cash flow projections to compute McDonald’s fair value. The average estimates of the next 5 years are utilized for a Base Case scenario, the highest estimates for a Bull Case scenario, and the lowest estimates for a Bear Case scenario.
Base Case: $343.18 (37.3% upside)
Bull Case: $406.78 (62.7% upside)
Bear Case: $235.71 (-5.7% downside)
Weighted Average Price Target: $334, implying a 33.8% undervaluation.
III. Final Summary
McDonald’s is a globally recognized brand. Over the past decade, it has achieved notable improvements in net income, EPS, and free cash flow, alongside higher margins and a strong commitment to shareholder returns through increased dividends and substantial share buybacks. The company underwent a significant restructuring, transitioning to a model with a higher proportion of franchised restaurants. In 2014, McDonald's had 6,714 company-operated restaurants and 29,544 franchised restaurants. By 2023, the number of franchised restaurants had grown to 39,680, while company-operated restaurants decreased to 2,142. This shift has been advantageous due to the increased profitability, capital expenditure savings, operational efficiencies, and scalability associated with franchised restaurants.
Going forward, McDonald’s has several growth drivers.
Main Drivers for the Future
Digital and Delivery Expansion: Continued investment in digital platforms and delivery services to enhance customer experience and operational efficiency.
Menu Innovation: Ongoing innovation in menu offerings to meet changing consumer preferences and attract a broader customer base.
Global Expansion: Accelerating global expansion with a target to reach 50,000 locations by 2027, driving substantial revenue growth.
Technology and AI Integration: Leveraging AI and cloud technologies to streamline operations, improve customer interactions, and boost service efficiency.
However, every business has its risks:
Main Risks
Market Saturation: Established markets' saturation could limit growth opportunities, requiring McDonald's to innovate continuously and enhance customer experience to retain its competitive edge.
Economic and Regulatory Challenges: Fluctuating economic conditions and stringent regulations, particularly related to health and environmental standards, could impact operations and profitability.
Intense Competition: The fast-food industry remains highly competitive, with new entrants and existing players innovating continuously. Maintaining market share amidst this competition is a significant challenge.
Supply Chain Disruptions: McDonald's global operations make it vulnerable to supply chain disruptions, which can affect inventory management, operational efficiency, and service delivery.
Consumer Preference Shifts: The shift towards healthier and more diverse food options requires continuous adaptation of McDonald's menu. Failure to align with these preferences could impact revenue growth.
Final Verdict: Next Round: Analysis 2.0
Given all these insights, I plan to take a closer look into McDonald's business before making an investment decision.
If you don’t want to miss any future analysis, please read below.
Whenever you’re ready!
The Finance Dude is all about securing your financial future.
Whenever you're ready, here's how I can help you:
📅 Daily Updates: My take on daily macro events and earnings reports.
🗓️ Weekly Recaps: A summary of the week’s most important financial events.
📊 Stock Analyses: Access to a comprehensive library of all previously analyzed stocks and exclusive, detailed, and data-driven analysis of new stocks.
✅ Monthly Best Buys: A monthly list of the top-5 stocks for that month.
📈 Watchlist & Portfolio: Exclusive access to my current watchlist and portfolio.
⏰ Live Tracking: Receive alerts when I buy or sell a stock.
🧮 Interactive Tools: Downloadable Excel files where you can play and make your own assumptions for the valuation of the stocks I analyze.
🎓 Learn: Weekly posts explaining key financial concepts.
Don’t forget to subscribe to my channel and stay tuned for the next analyses! 🫡
👉 For more insights from me, follow me on:
X: @LeFinanceDude
Instagram: @LeFinanceDude
YouTube: youtube.com/@lefinancedude
TikTok: @LeFinanceDude